

Price Elasticity of Supply Calculator (PES)
The price elasticity of supply calculator shows how strongly producers change the quantity supplied when the price moves. Choose the Method, enter the old and new price and quantity supplied (or the percentage changes directly), then click the Calculate button to get your price elasticity of supply (PES), both percentage changes and whether supply is elastic or inelastic. Also try the Consulting Fees Calculator.
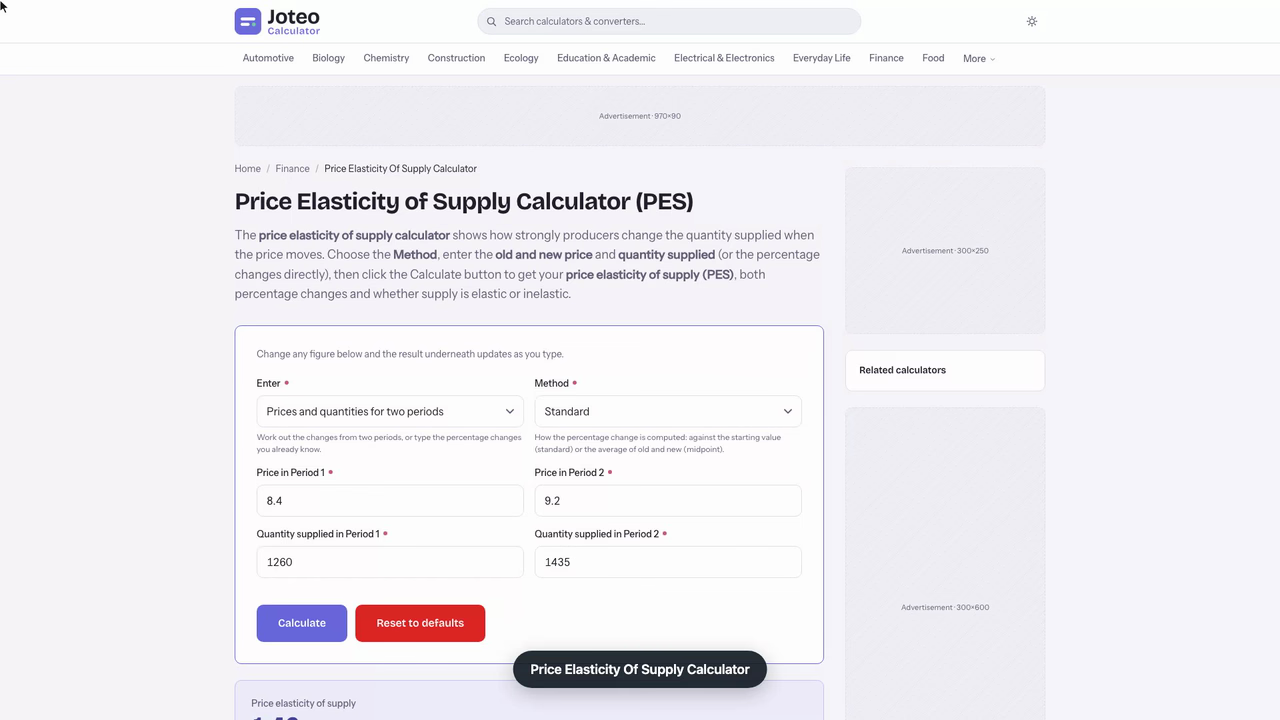
Price Elasticity Of Supply Calculator inputs and result
Price elasticity of supply
—
- % change in quantity supplied
- —
- % change in price
- —
- Elasticity outcome
- —
- Elasticity summary
- —
Table of contents
Who wrote and checked this page


Use the price elasticity of supply calculator to turn two prices and two quantities into one PES figure that shows the responsiveness of producers to a price move. Enter the percentage change in quantity supplied and the percentage change in price, or let the tool work them out with the midpoint approach, and you get a ratio that tells you at once whether supply is elastic or inelastic.
What Is Price Elasticity of Supply?
Price elasticity of supply measures how far the quantity supplied moves when the price of a good changes. Economists shorten it to PES, and in microeconomics it sits beside demand as one of the core ideas for reading a market. It is the percentage change in output offered divided by the percentage change in price, taken along a supply curve. Macroeconomics courses lean on the same idea when they ask how fast production can respond to a price signal, and firms use it to judge how quickly they can scale up.
Why PES Is Positive and the Law of Supply
The law of supply says that producers offer more when the price rises, so price and quantity move in the same direction along the supply curve. That makes the result positive, and calculators usually show its absolute value. The price elasticity of demand, by contrast, normally comes out negative, which is why the two are read differently.
Price Elasticity of Supply Formula and Midpoint Method
The price elasticity of supply formula divides one percentage by another. To calculate price elasticity of supply, find the percentage change in quantity supplied, find the percentage change in price, and divide the first by the second:
$$PES = \frac{\%\Delta Q_s}{\%\Delta P}$$
The same price elasticity of supply equation works with two ways of measuring a percentage change. The standard way divides each change by the starting value, \(\Delta x = (x_2 - x_1) / x_1\). The price elasticity of supply midpoint formula divides by the average of the old and new values instead:
$$\Delta x = \frac{x_2 - x_1}{(x_1 + x_2)/2}$$
Change in Quantity Supplied
Subtract the old quantity supplied from the new quantity supplied, then divide by the old quantity. If a farm stand sells 200 units and then 230, the change is 30 units, which is a 15% percent change in the amount supplied.
Percentage Change in Price
Do the same with price: subtract the old price from the new price and divide by the old price. Dividing the quantity result by this price result is the final step, and the outcome is your PES.
Standard Versus Midpoint Method
The standard method gives a slightly different PES for a price rise than for a price fall of the same size, because the base changes. Using the midpoint method removes that gap, so the price elasticity of supply comes out identical whichever direction you move. In the honey example below it is 1.46 with the standard method and 1.43 with the midpoint one; choose midpoint when you want one stable figure for a two-point comparison.

How to Use the Price Elasticity of Supply Calculator
You can work through this step-by-step in under a minute:
- Choose the method, standard or midpoint.
- Enter the price in Period 1 and the price in Period 2.
- Enter the quantity supplied in Period 1 and in Period 2.
- Or skip the periods and type the percentage changes directly into the price elasticity of supply inputs.
- Read the elasticity of supply that comes back, along with its label.
Price Elasticity of Supply Calculator Inputs and Results
The change in price and the change in quantity supplied appear as you type, so you can see each stage of the sum. The headline result is the coefficient, and the label beside it tells you whether supply is elastic, inelastic or unit-elastic. Because the quantity supplied needs time to adjust, run the tool once for a quick reaction and again for a longer window.
Calculating PES: Worked Examples and Sensitivity
Take a honey producer whose price per 340 g jar rises from $8.40 to $9.20 while the quantity supplied climbs from 1,260 to 1,435 jars. The producer wants to know whether adding hives next season pays off. These price elasticity of supply examples use the same numbers for both methods: See also our Margin And VAT Calculator.
| Method | % change in quantity | % change in price | PES |
|---|---|---|---|
| Standard | 13.89% | 9.52% | 1.46 |
| Midpoint | 12.99% | 9.09% | 1.43 |
| Short-window output of 1,330 jars (standard) | 5.56% | 9.52% | 0.58 |
A PES above 1 means the business can raise output faster than the price climbs, and revenue and profit rise with it. The last row is the sensitivity check: if cost of production or input prices limit the harvest to 1,330 jars, the same price rise gives 0.58 and supply turns inelastic. At a market equilibrium that shifts often, that gap between 1.46 and 0.58 is the number to watch. Trust a single two-point estimate only when no other event, such as a drought or a new competitor, moved the price.

Types of Elasticity: Elastic, Inelastic and Unit Elastic Supply
The size of the coefficient sorts supply into five types, from zero to infinite. Anything above 1 is elastic, anything below 1 is inelastic, and exactly 1 is unit-elastic. You might also find our Inventory Turnover Calculator useful.

Inelastic Supply: PES Below 1
With relatively inelastic supply, the quantity supplied moves by a smaller percentage than price. A vineyard cannot replant overnight, so its quantity supplied barely reacts to a price spike.
Elastic Supply: PES Above 1
With relatively elastic supply, the quantity supplied grows by a larger percentage than price. A printing shop with idle presses can usually do this.
Unit Elastic at a Value of 1
When both percentages match, supply is unit elastic, and a 6% price rise brings a 6% rise in output.
Perfectly Inelastic and Perfectly Elastic Extremes
Can the ratio be zero? Yes. Perfectly inelastic supply has PES of 0 and a vertical line on the graph, as with a cinema whose fixed seats cap the movie tickets it can sell. Perfectly elastic supply has an infinite value and a horizontal line, as when every firm in a labor market must pay the same wage and workers appear at any firm matching it. Perfectly inelastic supply and perfectly elastic supply are limits that real markets only approach.
Reading the Elasticity of Supply for a Cold Brew Bottling Line
Dana runs a small cold brew business and has to decide this week whether to raise the shelf price again. Her question: if she charges more, will the line actually bottle more, or is she already at its limit? Last month she raised the price of a 1-litre bottle from $11.75 to $12.90, and weekly output moved from 842 to 981 bottles.
She enters the two prices and two quantities with the standard method selected. The percentage change in quantity supplied is (981 − 842) / 842, or 16.51%, and the percentage change in price is 9.79%. The result is PES 1.69, so supply is elastic. Switching to the midpoint method gives 15.25% over 9.33%, or 1.63. She recomputes it by hand to confirm both figures, then takes the more cautious 1.63.
| Scenario | Bottles per week | PES (standard) |
|---|---|---|
| Observed response | 981 | 1.69 |
| If only 905 bottles came out | 905 | 0.76 |
The sensitivity row is what she cares about. Anything under 1 would mean the extra price is mostly sticker shock, because a PES of 0.76 says output grew less than price did. A PES of 1 is the textbook line between inelastic and elastic supply, and she is comfortably above it.
Next she tests a $13.50 price. Holding PES at 1.69, a 4.65% price increase suggests about 1,058 bottles a week. Here the edge case bites: her bottling line tops out near 1,000 a week, so the formula's projection is not trustworthy past that ceiling. The ratio describes the range she has already observed, not a promise beyond it.
My own judgement call: the number to watch is not the coefficient but the capacity ceiling. Dana holds the price at $12.90 until a second bottling shift is booked, then reruns the figures with the new quantity.
Determinants of Elasticity of Supply
Several forces decide where a producer lands on the scale, and the main determinants are cost, time and how easily factors of production can be moved.
Marginal Cost and Spare Capacity
If marginal cost climbs steeply as output rises, supply stays inelastic. If it rises slowly, supply is elastic. A bakery with spare capacity in its ovens can bake extra bread at little added cost, which is the flexible capacity that makes supply respond quickly.
Time, Number of Firms and Mobility of Factors of Production
Elasticity grows with time, because firms can hire, build and reorganize. More firms means more potential entrants to fill a gap, and high mobility of factors of production, labor and inputs that can move between uses, lets capacity expand fast.
Price Elasticity of Supply Short-Run and Long-Run
In the short-run, a grower cannot change this season's crop, so supply is inelastic. In the long-run, the same grower shifts acres from wheat to potatoes after a price change, which is why the agricultural sector shows rising elasticity as the time window widens.
Why Price Elasticity of Supply Matters to Businesses
Read your result as a decision aid: a PES above 1 means a firm can expand output faster than price climbs, while a PES below 1 means a price rise will not be matched by output. Managers raise elasticity with overtime, with flexible capacity, by choosing to outsource peak work, or with just in time stock management, and each option costs money, so extra profit is weighed against extra expense. A low result also matters beyond the firm: welfare effects and the deadweight loss of a tax fall more heavily on the less elastic side. For a fuller picture of any business and its customers, compare it with income elasticity of demand or a cross price elasticity check.
FAQs around Price Elasticity Of Supply Calculator
1. What does price elasticity of supply measure?
It measures how responsive the quantity supplied is to a change in price: the percentage change in quantity supplied divided by the percentage change in price along a supply curve.
2. How do I calculate price elasticity of supply?
Find the percentage change in quantity supplied, find the percentage change in price, then divide the first by the second. The calculator does all three steps once you enter the old and new values.
3. What is the difference between the standard and midpoint methods?
The standard method divides each change by the starting value, so a price rise and an equal price fall give slightly different results. The midpoint method divides by the average of old and new, so the answer is the same in both directions.
4. What do elastic, inelastic and unit elastic supply mean?
A PES above 1 is elastic (quantity moves by a larger percentage than price), below 1 is inelastic (a smaller percentage), and exactly 1 is unit elastic.
5. Can the price elasticity of supply be zero?
Yes. If quantity supplied does not change when price changes, supply is perfectly inelastic and PES is 0. A perfectly elastic supply has an infinite PES.
6. Why is price elasticity of supply usually positive?
The law of supply says producers offer more when price rises, so price and quantity supplied move in the same direction and the ratio is positive. This calculator shows the absolute value.
7. What determines how elastic supply is?
Mainly the availability of inputs and spare capacity, how steeply marginal cost rises, the number of firms, how mobile factors of production are, and the time producers have to respond.
8. Is supply more elastic in the short run or the long run?
Usually the long run, because producers have more time to expand capacity, hire and switch production than they do in the short run.
Report an issue with this page
Spotted a wrong result or unclear explanation? Report an issue or read our editorial policy.