

Inventory Turnover Calculator: Inventory Turnover Ratio
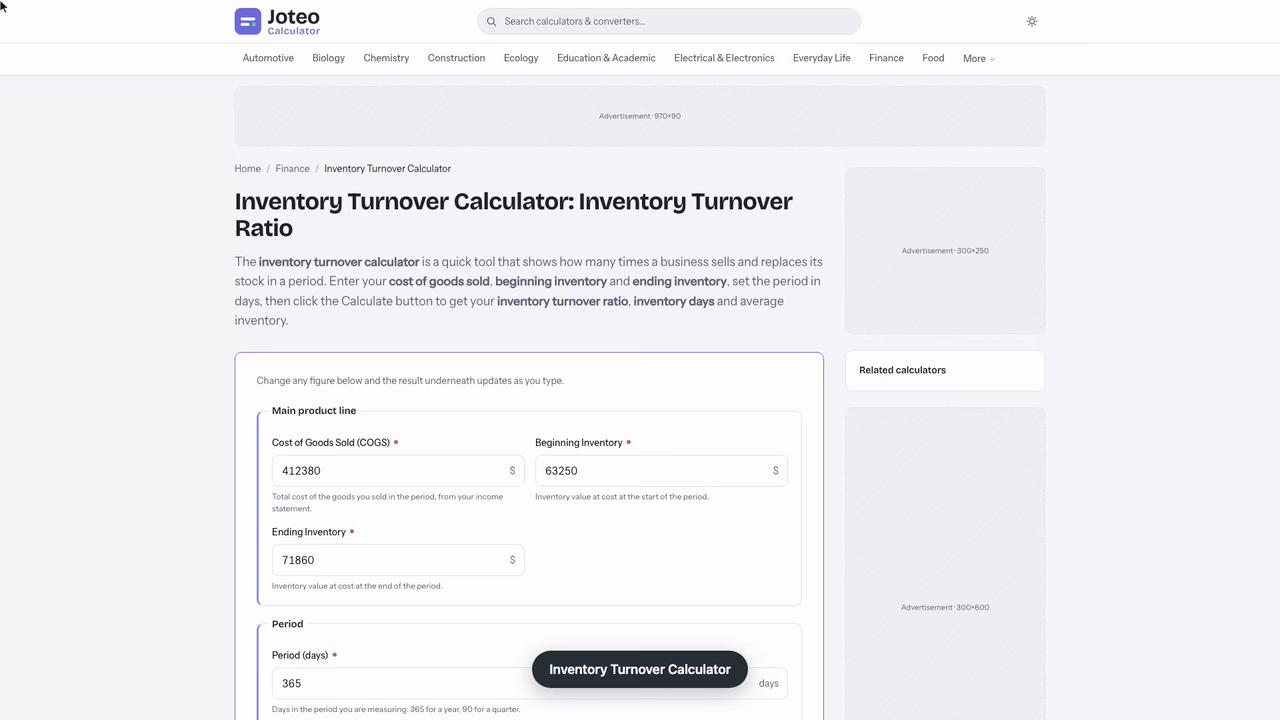
The inventory turnover calculator is a quick tool that shows how many times a business sells and replaces its stock in a period. Enter your cost of goods sold, beginning inventory and ending inventory, set the period in days, then click the Calculate button to get your inventory turnover ratio, inventory days and average inventory. Also try the Safety Stock Calculator.
Inventory Turnover Calculator inputs and result
Inventory Turnover
—
- Inventory Days (Days on Hand)
- —
- Average Inventory
- —
- Turns per Year (Annualized)
- —
Table of contents
Who wrote and checked this page


Use this inventory turnover calculator to see how many times your business sold and replaced its stock in a period. Enter your cost of goods sold and the average inventory you held, and you get the turnover ratio plus the number of days a typical item waits before it sells, which is the quickest read business owners have on whether their stock is working or just sitting.
What Is Inventory Turnover as a Financial Efficiency Ratio?
Inventory turnover counts how many times a company sold through the stock it held during a period. You will also see it called inventory turns, merchandise turnover or simply the turnover rate. A higher number means goods leave the shelf quickly; a lower one means money is parked in a warehouse.
Inventory appears among the current assets on the balance sheet, covering raw materials, work in process and finished goods. Because it should convert to cash within a year, how fast it moves shapes liquidity and the company's cash conversion cycle. Standard practice records it at cost, so the inventory turnover ratio the calculator returns is built from cost figures rather than prices charged to customers.
Average Inventory and COGS in the Inventory Turnover Formula
The inventory turnover formula divides COGS by the average inventory over the same period. Take COGS from the income statement and the opening and closing stock values from the balance sheet, covering one fiscal year or another accounting period, all stated at cost and never at retail price.
$$\text{Inventory turnover ratio} = \frac{\text{COGS}}{\text{Average inventory}}$$
$$\text{Average inventory} = \frac{\text{Beginning inventory} + \text{Ending inventory}}{2}$$
Averaging the two balances smooths out a stock level that spikes or dips on the day of the count. Use COGS, not revenue: revenue contains your markup and gross profit, so it inflates the inventory turnover calculation by roughly your markup and no longer matches the benchmarks, which are all built on COGS. If you only know sales, multiply them by your product cost percentage to estimate COGS.

Days Inventory Outstanding and Days on Hand
The same fact can be told in time. Days inventory outstanding (DIO), also called inventory days or days sales of inventory, shows how long cash stays tied up before stock sells. Divide the days in the period by the turnover ratio.
$$\text{Inventory days} = \frac{365}{\text{Turnover ratio}}$$
Expressed as inventory days on hand, a turnover of 5 means a unit waits about 73 days. For a month or quarter, work out the turnover for those days, then multiply to get an annualized figure so periods stay comparable.

How to Use the Inventory Turnover Calculator
Gather three numbers from your financial statements, then follow these steps:
- Enter cost of goods sold for the period, taken from your income statement.
- Enter the beginning inventory, valued at cost.
- Enter the ending inventory, also at cost.
- Click the Calculate button to read the inventory turnover ratio, the average inventory and the days to sell.
Any inventory turnover ratio calculator gives the same answer from the same inputs, so the work is in choosing clean inputs. Keep the period identical for all three, and do not mix quarterly COGS with annual stock values when you calculate inventory turnover.
Worked Example: A Garden Centre's Year of Stock
A garden centre reports COGS of $412,380 for the year, with stock of $63,250 at the start and $71,860 at the end.
| Step | Calculation | Result |
|---|---|---|
| Average inventory | ($63,250 + $71,860) ÷ 2 | $67,555 |
| Turnover | $412,380 ÷ $67,555 | 6.10 times |
| Days to sell | 365 ÷ 6.10 | 59.8 days |
The garden centre turned its stock about six times and held each item roughly 60 days. That blended figure can hide a spread, since seedlings may sell in weeks while patio furniture sits for months. Repeat the calculation for each product line, or per SKU if your records allow, to see where the slow money is.

What Is a Good Inventory Turnover Ratio? Industry Benchmarks
There is no universal good inventory turnover ratio. A supermarket sells perishable food many times a year, a jewelry store holds costly pieces for months, and manufacturing firms depend on lead times. Compare your inventory turnover result with a benchmark for your sector first, then with a peer company's history and your own, because a figure that is fine for a retail furniture showroom would signal trouble for a grocer.
Seasonality matters too. A year-end count taken right after the holiday rush understates average inventory and so inflates the result the calculator returns. Items with a short shelf life or an expiry date need quicker turns, while high-value goods carry a bigger holding cost and tend to turn slowly.
Checking a Bike Shop's Stock With the Inventory Turnover Ratio Calculator
I run the numbers for a bike shop owner who wants to know whether she can add a second repair stand's worth of parts without borrowing. Her question is simple: is the stock she already holds earning its keep? From her year-end books she reads off cost of goods sold of $287,450, opening stock of $41,720 and closing stock of $38,960, all on a cost basis.
I enter cost of goods sold first, then the two stock values, and click Calculate. The average comes back as $40,340, the turnover as 7.13 and the days figure as 51.2 days. I cross-check by hand: $287,450 ÷ $40,340 is 7.13, and 365 ÷ 7.13 is 51.2. Her supplier gives her 45 days to pay, so her 51.2 inventory days run about six days past the invoice due date, and her own cash funds that gap.
Then I change one input. Her closing count was taken in January, after the winter clearance, so I rerun it with a spring-level closing stock of $52,000:
| Closing stock | Average | Turnover | Days |
|---|---|---|---|
| $38,960 | $40,340 | 7.13 | 51.2 |
| $52,000 | $46,860 | 6.13 | 59.5 |
One count date moves the answer by a full turn, so I trust the figure only if the two balances were taken at comparable points in her season. My judgement is that the number to watch is average stock, not sales: to reach 8 turns on the same COGS she would need to hold no more than about $35,931, which is $4,409 less than today.
That gives her a concrete next step: to lift turnover to 8, she sells down slow-moving frames until the average lands near $36,000 and only then orders the extra parts, which brings days to about 46, level with her 45-day payment terms.
Why the Turnover Ratio Matters to Investors and Business Owners
Every turn earns gross profit, so faster turns lift profitability without a single price rise. For investors, a rising trend signals that the company is converting inventory to cash more efficiently, which supports healthy cash flow and a stronger financial position. Cash released from the shelf can pay suppliers, fund new products or reduce borrowing.
Extremes cut both ways. A very high figure may mean you run out, lose sales opportunities and disappoint customers through a stock out. A very low one points to slow sales or overstocking, ties up cash and forces markdowns that squeeze margin.
Improving Stock Turnover and Clearing Dead Stock
If your company's inventory turnover ratio trails the benchmark, the fix is less stock held or more goods sold from the same stock, so ask where your inventory is stalling and pull the levers that fit:
- Purchasing: order smaller batches and set a reorder point for each item, which cuts the stock you hold.
- Dead stock: discount or bundle obsolete inventory to turn it back into cash and shrink the average.
- Supply chain: agree shorter lead times with suppliers so you hold less safety stock and a smaller average.
- Pricing and marketing: promote slow lines and test price points.
- Operations: rotate the warehouse so older units ship first and write-offs stay out of the books.
Strong inventory control also means keeping one costing method, because switching between FIFO and LIFO changes COGS and therefore the result itself.
Comparing Inventory Management Ratios Across Companies
When you compare the inventory turnover of one company with another, line up the same period, the same cost basis and the same industry. A firm using LIFO reports a different COGS from a peer on FIFO, so check the accounting notes before concluding that one operator manages stock better. Track your own inventory management over several periods, because the direction of the trend tells you more than any single reading.
FAQs around Inventory Turnover Calculator
1. What is the inventory turnover formula?
Inventory turnover equals cost of goods sold divided by average inventory, where average inventory is beginning inventory plus ending inventory, divided by 2. Use cost figures for both, not retail prices.
2. How do I calculate inventory days?
Divide the days in the period by the inventory turnover ratio, or divide average inventory by COGS and multiply by the days. A turnover of 5 over a 365-day year gives 73 days.
3. Should I use sales or COGS?
Use COGS. Sales include your markup, so they inflate the ratio and stop it matching the days figure or industry benchmarks, which are built on COGS.
4. What is a good inventory turnover ratio?
It depends on your industry. Fast-moving goods such as groceries turn many times a year, while high-value items such as jewelry turn slowly, so compare against your sector and your own history.
5. Is a high inventory turnover always good?
Not always. A very high figure can mean you run out of stock and lose sales, while a low one points to slow sales or overstocking that ties up cash.
6. Can I calculate turnover for a month or a quarter?
Yes. Enter COGS and inventory for that period and set the number of days. The calculator shows the period turnover and an annualized figure so periods stay comparable.
7. How do I compare several product lines?
Enter each line's COGS and beginning and ending inventory in its own boxes. The result combines the lines, so run each line alone as well to see which one is slow.
Report an issue with this page
Spotted a wrong result or unclear explanation? Report an issue or read our editorial policy.