

MPS Calculator: Find Your Marginal Propensity to Save
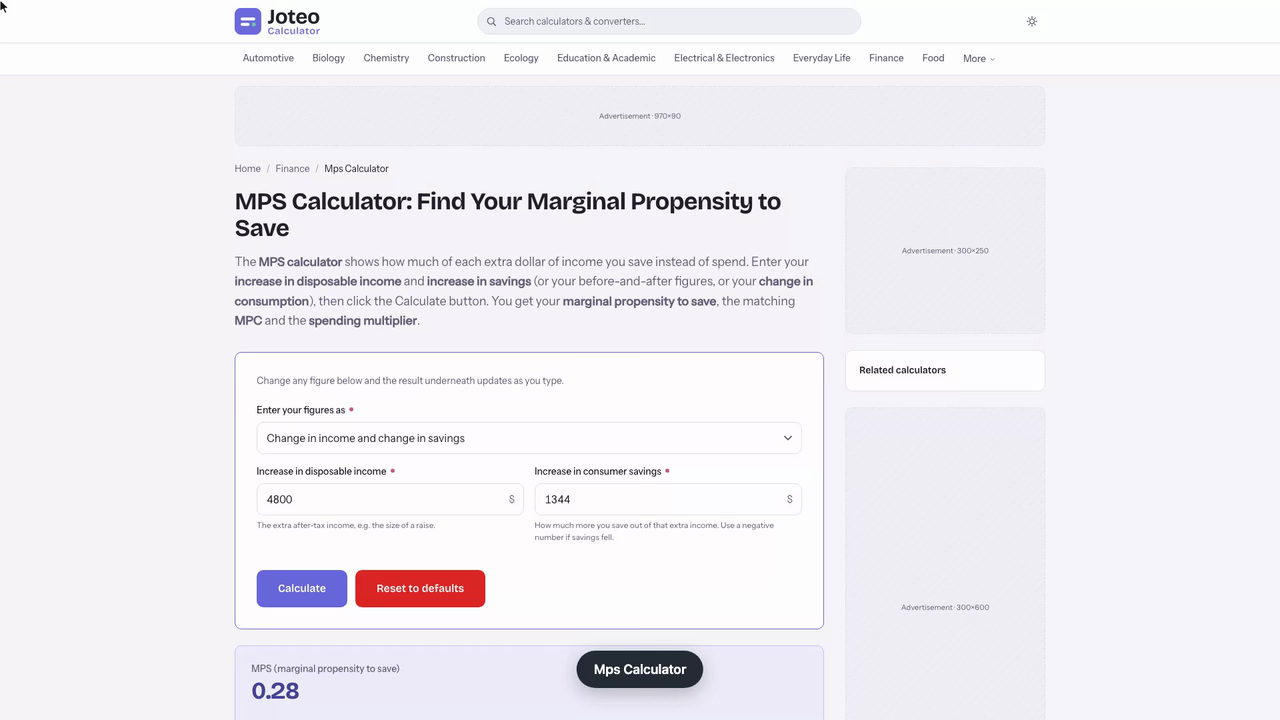
The MPS calculator shows how much of each extra dollar of income you save instead of spend. Enter your increase in disposable income and increase in savings (or your before-and-after figures, or your change in consumption), then click the Calculate button. You get your marginal propensity to save, the matching MPC and the spending multiplier. Also try the Financial Leverage Ratio Calculator.
Mps Calculator inputs and result
MPS (marginal propensity to save)
—
- MPC (marginal propensity to consume)
- —
- MPC + MPS
- —
- Spending multiplier (1 ÷ MPS)
- —
- Change in income
- —
- Change in saving
- —
- Change in consumption
- —
- What your result means
- —
Table of contents
Who wrote and checked this page


A raise or a bonus rarely lands in your account untouched: some of it gets spent and some gets put aside. The MPS calculator measures the second part, your marginal propensity to save, which is the fraction of each dollar of additional income you keep rather than send to consumption. Enter your income and savings from before and after a change in income, and you get back the share you save and the share you spend.
What the Marginal Propensity to Save Measures
Your MPS answers one narrow question: when your disposable income (what's left after taxes) goes up by one dollar, how many cents of that extra dollar do you keep? It looks only at the change, not at your totals. A family that already banks a large share of its pay can still have a low MPS if it spends almost all of a raise, and the reverse happens just as often.
Because it is a ratio of two dollar changes, the result is a plain decimal, usually between 0 and 1. Economists track it across households because it shows how household savings respond when pay changes, and that response is what tax and spending policy depend on.
MPS and MPC: Two Shares of One Dollar
Every new dollar has only two places to go: you spend it or you keep it. The spent share is the marginal propensity to consume (MPC), the change in consumption divided by the change in your pay. Since the two shares cover the whole dollar, they always add up to exactly 1:
$$\text{MPC} + \text{MPS} = 1$$
Know either one and you have the other. An MPC of 0.85 means you put aside 15 cents of each new dollar.
Is MPS the Same as Your Saving Rate?
No. Your saving rate is everything you save divided by your total income, an average across all of your earnings. The marginal ratio looks only at the newest slice. The spending side has the same split: the average propensity to consume is total spending over total pay. Someone who saves 9% of their salary overall might keep 40% of a raise, so the two numbers can sit far apart. Multiply either decimal by 100 to read it as a percentage.
The MPS Formula, Step by Step
The marginal propensity to save formula divides the change in savings by the rise in pay over the same period:
$$\text{MPS} = \frac{\Delta S}{\Delta Y} = \frac{S_{new} - S_{initial}}{Y_{new} - Y_{initial}}$$
- ΔS, the change in savings: new savings minus initial savings
- ΔY, the change in income: new income minus initial income
Measure both changes over the same stretch of time and in the same units. Mixing a monthly pay figure with a yearly saving figure is the most common way to get a nonsense answer.
Worked Example: Calculate MPS from a Change in Income
Say your pay goes from $58,400 to $63,200 after a salary increase, and over the same year the amount you set aside grows from $6,150 to $7,494.
| Step | Calculation | Result |
|---|---|---|
| Rise in pay (ΔY) | $63,200 − $58,400 | $4,800 |
| Rise in amount saved (ΔS) | $7,494 − $6,150 | $1,344 |
| Saving share | $1,344 ÷ $4,800 | 0.28 |
| Spending share (MPC) | 1 − 0.28 | 0.72 |
You keep 28 cents of every new dollar and spend 72 cents, which works out to $3,456 of the $4,800 raise going into spending.

How to Use the MPS Calculator
- Type your pay before the change and your pay after it, in the same units (yearly, monthly or per paycheck).
- Type how much you set aside at each point. Use the amount saved per period, not your account balance.
- Click the Calculate button.
- Read the saving share and the spending share (MPC). The two should add up to 1.
If you are checking an economics homework answer, enter the textbook's figures exactly as given. The tool needs a real change in pay to work with, because identical before and after figures leave nothing to divide by.
Testing a Step Raise Against the 50/30/20 Rule with the MPS Formula
A respiratory therapist moves up one step on her hospital's pay scale and wants to know whether the raise is actually reaching her emergency fund, or quietly disappearing into everyday spending. The short answer: she is keeping about 9 cents of each new dollar, an MPS of 0.093, far below the 20% savings slice the 50/30/20 budgeting guideline suggests.
She has two things to work from: three months of bank statements before the step and three after. She averages each set rather than using one month, because a single paycheck can include overtime or a one-off reimbursement. Then she enters, in order:
- Take-home pay before: $4,186.40 a month. She uses take-home, not gross, because the ratio is about disposable income.
- Take-home pay after: $4,612.75.
- Monthly amount saved before: $512.30 (automatic transfer plus what was left in checking at month end).
- Monthly amount saved after: $551.90.
The tool takes the two differences, $39.60 saved out of $426.35 more pay, and divides: 39.60 ÷ 426.35 = 0.0929. The spending share is 0.9071, so roughly $4,641 of the yearly raise goes to spending and $475 to savings. I recheck by hand, and the figures match.
What stands out is the knock-on effect. Before the step she saved 12.24% of her pay; after it, 11.96%. A raise made her overall share of pay saved go down, because the new slice is saved at a much lower rate than the old pay. To hold 12.24%, she would need to save $52.17 of the $426.35, a marginal ratio of 0.1224. Here's a quick rerun with that one input changed:
| Extra saved per month | Marginal ratio | Share of total pay saved |
|---|---|---|
| $39.60 (actual) | 0.093 | 11.96% |
| $52.17 (break-even) | 0.122 | 12.24% |
| $85.27 (20% of the raise) | 0.200 | 12.95% |
One caveat she almost missed: her pay stub shows the step as $590 gross. Dividing $39.60 by that gives 0.067, which understates how much of the money she actually received was kept. Taxes and deductions took that gap before she could spend or save any of it, so the take-home figure is the right denominator.
Her next move is concrete: raise the automatic transfer by $45.67 a month, to the $85.27 that equals 20% of the raise, and rerun the numbers after another three statements. In my view the input to watch is the "after" amount saved. Pay is fixed by the scale; the saved figure is the only number she controls.
Reading Your MPS Value
A result between 0 and 1 is the normal case. Close to 0 means nearly the whole raise is being spent; close to 1 means almost all of it is kept. A result above 1 usually points to an input mistake, such as typing an account balance instead of the yearly amount saved. If your pay didn't change at all, the answer is undefined.

Dissaving and a Negative Result
If your pay rises but you put away less than before, the ratio turns negative. A negative MPS is a sign of dissaving: drawing down past savings or borrowing to fund spending that grew faster than your pay. One bad quarter can produce it, for example after a large car repair, so check whether the drop repeats before you treat it as a debt problem.
What Counts as a Good Propensity to Save?
There is no universal target. The right share depends on your goals, your emergency cushion and whether you're paying down loans, which can sensibly pull it lower for a while. What matters more is the trend: compare your saving habits across two or three raises. If the share keeps shrinking, lifestyle costs are absorbing every increase.
What Shapes Your Propensity to Save
- Pay level: higher earners tend to keep more of a raise because their essentials are already covered.
- One-off or permanent: a one-time bonus is more likely to be put aside than a lasting raise, which people fold into everyday spending.
- Interest and prices: better returns on deposits reward waiting, while high inflation pushes people to buy before prices climb.
- Confidence and age: worry about job security raises saving, and people near retirement often save harder than recent graduates.
These forces are why the ratio this calculator returns can move from one raise to the next even when your habits feel unchanged: a one-off bonus usually produces a higher result than a permanent raise of the same size. They also explain why consumer behavior differs so much between people, why your own saving behavior can shift between calculations, and why household consumption data shows the saved share climbing with pay.
MPS and MPC in the Spending Multiplier
Your saving share also shows how far a dollar of new spending travels through the economy. Each round, the part that's kept leaks out of the spending chain, so the spending multiplier is one divided by the saving share. With the worked example's figures: See also our Apc Calculator.
$$k = \frac{1}{\text{MPS}} = \frac{1}{0.28} \approx 3.57$$
The tax multiplier is \(-\text{MPC} \div \text{MPS}\), about −2.57 for the same figures. That's why fiscal policy designers care whether people spend or bank a tax rebate: a lower saving share means a stimulus payment feeds more aggregate demand.

Why MPS Doesn't Feed the Money Multiplier
The money multiplier sounds similar, so keep it apart from the result this calculator gives. It links the money supply to bank reserves through the reserve ratio, and your saving share never enters it. If a homework question asks for a multiplier from a saving share, it wants the spending one above.
The Paradox of Thrift: When a Higher MPS Hurts Growth
Saving more is sensible for one family. When everyone raises their saving share at once, though, spending falls, firms sell less, and gross output shrinks. Earnings fall with it, so total saving may not rise at all. This is the paradox of thrift, a classic fallacy of composition in macroeconomics: what is true for one household is false for all of them together. You might also find our Return on Equity Calculator useful.
The 2008 recession showed it in practice. Households that owed a lot pushed their saving share up to repay loans, a wave of deleveraging, and with more of each dollar held back, less of it circulated as new demand. That lifted the unemployment rate and pushed prices toward deflation; falling prices raised the real interest rate, so the debt burden grew even as people paid it down, and economic growth stalled.
Using MPS for Personal Finance and Budget Planning
For your own money, the useful move is to pick your saving share before the next raise arrives. If you want to keep 30 cents of each new dollar, set up an automatic transfer for that slice in the month the raise starts. The next time you run the numbers, the result tells you whether the plan held. A share that keeps drifting down means the extra pay is going to spending you never chose.
FAQs around Mps Calculator
1. How do I calculate MPS by hand?
Subtract your old income from your new income and your old savings from your new savings, then divide the change in savings by the change in income. If income rose by $4,800 and savings by $1,344, MPS = 1,344 ÷ 4,800 = 0.28.
2. Why do MPS and MPC always add up to 1?
In this model every extra dollar of income is either spent or saved, so the share spent (MPC) and the share saved (MPS) together cover the whole dollar. Knowing one gives you the other: MPS = 1 − MPC.
3. Can MPS be negative?
Yes. If your income rises but your savings fall, the change in savings is negative and so is MPS. That signals dissaving, meaning you are drawing down savings or borrowing to fund extra spending.
4. What happens if my income doesn't change?
MPS divides by the change in income, so a change of zero leaves nothing to divide by and the result is undefined. You need two different income figures to calculate it.
5. Is MPS the same as my saving rate?
No. Your saving rate is total savings divided by total income. MPS looks only at the extra income and how much of that extra amount you save, so the two can be very different.
6. How does MPS relate to the spending multiplier?
The spending multiplier equals 1 ÷ MPS. The smaller the share people save, the more of each new dollar is spent again, so a lower MPS means a bigger multiplier. An MPS of 0.28 gives a multiplier of about 3.57.
7. What affects someone's marginal propensity to save?
Income level, whether the extra money is a one-off bonus or a permanent raise, interest rates, inflation, consumer confidence and age all shape how much of new income people save.
Report an issue with this page
Spotted a wrong result or unclear explanation? Report an issue or read our editorial policy.