

Return on Equity Calculator (ROE): Formula & Examples
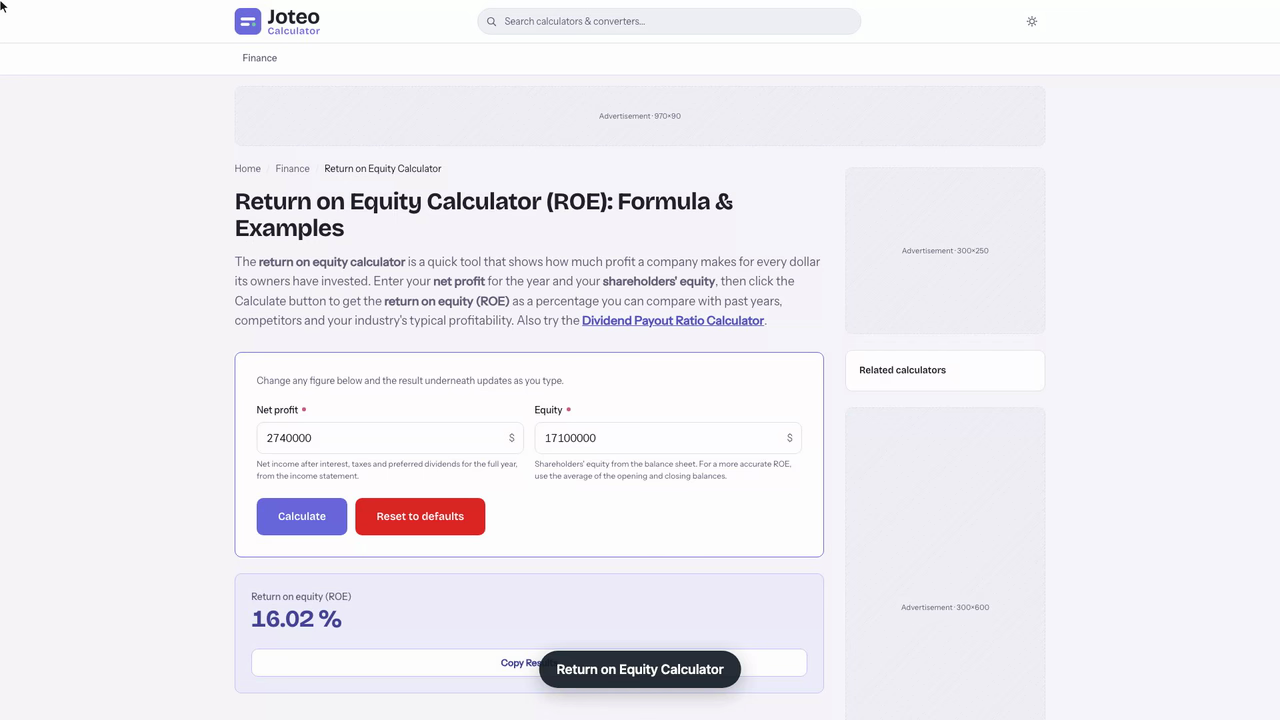
The return on equity calculator is a quick tool that shows how much profit a company makes for every dollar its owners have invested. Enter your net profit for the year and your shareholders' equity, then click the Calculate button to get the return on equity (ROE) as a percentage you can compare with past years, competitors and your industry's typical profitability. Also try the Cash Flow per Share Calculator.
Return on Equity Calculator inputs and result
Return on equity (ROE)
—
Table of contents
Who wrote and checked this page


Two numbers from a company's annual report are all your return on equity calculator needs: net income and the equity its owners have tied up in the business. Enter both and you get ROE as a single percentage that shows how hard each dollar of shareholder money is working, the same figure investors and lenders use to judge profitability, efficiency and overall financial health.
What Is Return on Equity (ROE)?
Return on equity is a financial ratio that measures how much a company earns for every dollar of shareholders' equity, the money owners have put in or left in the business. Because it compares the year's result with the owners' stake, it is classed as a profitability ratio, and analysts sometimes call it return on net worth (RONW) or the return on net assets, since book equity equals total assets minus total liabilities.
A higher ROE means management is producing more net income from the same equity base. An ROE of 16% says that for every $100 of equity on the balance sheet, the company generated $16 of profit over the year. That makes the ratio a fast read on capital allocation: whether the management team is putting shareholders' money into projects that earn more than that money costs.
The Return on Equity Formula
The ROE formula divides the bottom line by the owners' stake and expresses the answer as a percentage:
$$\text{ROE} = \frac{\text{Net Income}}{\text{Average Total Equity}} \times 100$$
- Net income, also called net earnings, is what is left after interest, taxes and preferred dividends. It equals total revenue minus total expenses and sits on the last line of the income statement.
- Equity is the owners' residual claim, built from common shares, preferred shares, contributed capital and retained earnings, less any treasury stock the company has repurchased.
Under standard accounting rules, both inputs come straight from published statements, so two analysts working from the same filing should reach the same answer. If a large division was sold during the year, use the figure for continuing operations so a one-off gain does not flatter the result.
Why Average Equity Beats Year-End Equity
Net income builds up across a whole fiscal year, while equity is a snapshot taken on one date. If equity grew sharply during the year, because profits were retained or new shares were issued, dividing by the closing figure understates the return. Averaging the opening and closing balances lines the denominator up with the period the numerator covers:
$$\text{Average Equity} = \frac{\text{Opening Equity} + \text{Closing Equity}}{2}$$
For companies that report quarterly, averaging four or five quarter-end balances gives an even closer match to the money shareholders actually had at work.
How to Calculate Return on Equity Step by Step
- Pull the full-year bottom-line figure from the most recent annual filing.
- Find equity at the start and end of that year on the two most recent balance sheets.
- Add the two equity balances and divide by two.
- Divide the year's earnings figure by average equity and multiply by 100 to express ROE in percent.
- Compare the result with prior years and with peers in the same industry.
Worked ROE Example: A Furniture Manufacturer
Suppose you are reviewing a furniture maker that reported $2.74 million of net income. Its equity stood at $15.9 million at the start of the year and $18.3 million at the end, so average equity is $17.1 million.
$$\text{ROE} = \frac{2.74}{(15.9 + 18.3) \div 2} \times 100 = \frac{2.74}{17.1} \times 100 = 16.0\%$$
Had you used only the closing balance, the return on equity calculation would show 14.97%; the opening balance alone would give 17.23%. The average sits between them and is the figure to quote, because it reflects the equity the business carried through the year rather than on a single day.

| Equity basis | Equity used | Resulting ROE |
|---|---|---|
| Opening balance | $15.9M | 17.23% |
| Average of opening and closing | $17.1M | 16.02% |
| Closing balance | $18.3M | 14.97% |
How to Use This ROE Calculator
The tool needs only two inputs, and both come from filings you can download for free.
- Enter net income for a full 12 months. Some sources label it earnings after tax; it is the same figure.
- Enter the equity attributable to shareholders, ideally averaged across the same 12 months.
- Read the result, shown to two decimals, and note whether equity was positive.
If you prefer to calculate ROE by hand, the ROE equation above takes one division. The tool simply removes the chance of an arithmetic slip and lets you test several years or companies in a row.
Checking a Landscaping Firm's Return on Equity Ratio Before a Payout Vote
Dana Whitlock co-owns a commercial landscaping firm, and the three partners meet next week to vote on a year-end cash distribution. Before the meeting she wants one number that shows how well the money already left in the firm has been working, so she opens the reviewed 2025 statements.
The profit and loss page shows $412,630 after tax. Equity was $1,847,200 on January 1 and $2,106,950 on December 31, the increase coming almost entirely from profits the partners chose not to withdraw. Because the balance rose by more than $250,000 during the year, she averages the two balances rather than using the closing figure, which gives $1,977,075.
She enters $412,630 and $1,977,075. The calculator shows a return on equity of 20.87%. Out of curiosity she swaps in the December balance alone and gets 19.58%, a gap of almost 1.3 points that would have made the year look weaker than it was.
Next she tests the proposal on the table: a $250,000 distribution taken out of the year-end balance. She lowers the closing balance to $1,856,950, the average becomes $1,852,075, and ROE climbs to 22.28%.
- Operating result: unchanged at $412,630.
- ROE before the payout: 20.87%, already above the 15% line analysts commonly treat as strong.
- ROE after the payout: 22.28%, a 1.41-point rise produced purely by shrinking the owners' stake.
That tells her exactly what to put in the memo. The distribution is affordable, but the higher figure should not be read as better performance. She writes that the partners' 2026 target will be measured against the 20.87% pre-distribution baseline, and that any future jump will be checked with the DuPont split before anyone credits it to operations.
What Is a Good Return on Equity?
A common rule of thumb puts a healthy ROE between 15% and 20%, with anything under 5% treated as weak. Those thresholds are only a starting point, because typical returns vary widely by sector: asset-heavy utilities often report single-digit figures, while asset-light software firms can post results above 30% with little borrowing.

- Below 5%: low; owners earn less on their capital than a savings account might pay.
- 5% to 10%: modest; acceptable for mature, capital-intensive firms.
- 10% to 15%: solid, in line with long-run averages for many listed companies.
- 15% to 20%: strong; the ROE range most shareholders hope to see.
- Above 20%: excellent, but check whether debt or buybacks are driving the ROE.
Also watch the direction of change. A slide from 18% to 12% over three years matters more than a steady 12%, because it usually signals margins under pressure or equity piling up faster than the firm can put it to work. Pair the number with the reasons behind it, and the ratio becomes a genuine diagnostic rather than a score.
Reading the ROE Ratio Over Time and Against Peers
A single figure tells you little on its own. Two checks turn it into insight. A time analysis, which is a historical comparison of the same company over five or more years, shows whether returns are rising, stable or eroding. A competitive analysis sets the number against comparable companies and direct competitors, since peer comparisons are only fair when the firms share a similar capital structure and cost base.
The DuPont Formula: What Drives Your ROE
The DuPont analysis splits return on equity into three multiplied parts, so you can see whether a strong result comes from margins, from how hard assets are worked, or from borrowing: See also our Mps Calculator.
$$\text{ROE} = \frac{\text{Net Income}}{\text{Sales}} \times \frac{\text{Sales}}{\text{Assets}} \times \frac{\text{Assets}}{\text{Equity}}$$
Run the furniture maker through it. With $31.5 million of total revenue and average assets of $39.8 million:
- Net profit margin: 2.74 ÷ 31.5 = 8.70%
- Asset turnover: 31.5 ÷ 39.8 = 0.79 times
- Financial leverage: 39.8 ÷ 17.1 = 2.33 times
- ROE: 8.70% × 0.79 × 2.33 ≈ 16.0%
The breakdown shows that more than half of this company's result comes from leverage: its return on assets is only 6.88%, and the 2.33 equity multiplier lifts that to 16.0%. A rival with the same ROE built on a 15% margin and very little debt would be the sturdier business, which is exactly what the single ratio hides.

How a Company Can Raise Its Return on Equity Ratio
Because the ratio has three drivers, a company has three honest ways to lift it, and one that deserves suspicion. Using the furniture maker's figures as the baseline shows how far each lever moves the result, holding the other two steady.
- Widen margins. Raising net profit from 8.70% to 10% of revenue, with turnover and leverage unchanged, lifts ROE to about 18.4%.
- Work the balance sheet harder. Clearing slow-moving inventory so turnover rises from 0.79 to 0.90 times pushes ROE to about 18.2%.
- Add borrowing. Raising the equity multiplier from 2.33 to 2.80 gives roughly 19.3%, but only if the extra debt costs less than it earns.
- Shrink equity. Paying out cash or buying back shares raises the ratio without improving operations at all, which is why analysts adjust for it before judging performance.
The first two levers raise the company's true profitability; the last two mostly shift risk onto the owners. When you compare two years of results, check which lever actually moved before crediting management with better performance. A jump from 16% to 19% built on new loans is a very different story from the same jump built on fatter margins, even though the headline number is identical.
ROE vs. ROA vs. ROCE: Return on Equity Compared
ROA divides net income by all assets, however they were financed, so it measures operating efficiency without the effect of borrowing. ROE looks only at the owners' slice. The return on capital employed (ROCE) sits in between, dividing operating profit by equity plus long-term debt, while ROIC uses after-tax operating income and invested capital.
If a company carried no borrowings at all, ROE and ROA would be identical. Every dollar of debt shrinks equity relative to assets and pushes ROE above ROA, which is why a company that looks superior on ROE alone may simply be over-leveraged. Pair the result with the debt-to-capital ratio before drawing conclusions about how the business uses borrowed funds.
Limitations of the Return on Equity Ratio
- Share buybacks reduce equity, so a stock buyback can raise ROE without any improvement in the underlying operations.
- Dividends owed to preferred holders cut the income left for common owners, lowering ROE even in a good year.
- A one-time gain or a large inventory write-down can swing a single year's result and distort the trend.
- Negative equity after years of losses or heavy buybacks makes the ratio meaningless: a loss divided by negative equity still produces a positive ROE, so check the sign of both inputs first.
- ROE is based on the book value of equity, not market capitalization, so it says nothing about whether the stock price is cheap or expensive.
Because of these distortions, treat ROE as one input alongside cash flow, debt levels and EPS growth rather than a standalone verdict on financial performance.
Common Mistakes When You Calculate Return on Equity
Most wrong answers come from feeding the formula mismatched inputs rather than from the arithmetic itself. Watch for these before you trust a result:
- Mixing periods. Pairing a trailing 12-month net profit figure with equity from an unrelated date skews the ratio in whichever direction equity moved.
- Using pre-tax profit. The top of the fraction must be after tax and after preferred payouts; otherwise the return on equity looks several points higher than owners actually receive.
- Using market value. Dividing by the company's market value instead of shareholders' equity turns ROE into a different ratio altogether.
- Ignoring minority interests. In group accounts, use net income attributable to the parent and equity attributable to the parent's owners, not the consolidated totals.
- Comparing unlike firms. A bank's ROE and a software company's ROE are not comparable; judge each against its own peer group.
Get these right and the return on equity ratio becomes a consistent yardstick you can apply to any company, year after year, with results you can defend.
Using the Return on Equity Calculator for Investment Decisions
For equity investors, ROE is shorthand for value creation. A company that consistently earns more on its equity capital than shareholders could earn elsewhere compounds shareholder value year after year, while one earning less is quietly eroding it. A sensible strategy is to screen for companies holding ROE above 15% for several years, then use DuPont to confirm that margins, not borrowing, are doing the work.
Owners of private firms can use the same ratio internally. If your ROE trails the return your shareholders could get from a comparable investment, that is a signal to raise margins, sell idle assets or rethink your financing mix. Property investors can run the same two-input check on a rental: enter its yearly net cash return as the income figure and their current stake in the property as the second input, then set that ROE against the local cap rate to decide whether to keep, refinance or sell, a core question in real estate finance.
FAQs around Return on Equity Calculator
1. How do I calculate ROE?
Find the company's net profit for the year and its shareholders' equity, divide the profit by the equity, and multiply by 100. For example, $2.74 million of net income on $17.1 million of average equity gives an ROE of 16.0%.
2. What is a good return on equity?
An ROE between about 15% and 20% is usually considered strong, 10% to 15% is solid, and anything under 5% is weak. Typical levels vary a lot by industry, so compare a company with its own history and with similar firms.
3. Is a 3% ROE good?
No. A 3% ROE is low for most companies and suggests the business is earning little on the money shareholders have invested. It can still be normal in a bad year or in a very asset-heavy sector, so check the trend before drawing conclusions.
4. Should I use year-end or average equity?
Average equity is more accurate. Net profit is earned over the whole year, while equity is a balance on one date, so averaging the opening and closing balances matches the two figures to the same period.
5. What does it mean if equity is negative?
When shareholders' equity is negative, the ROE figure can't be read normally. A loss divided by negative equity still produces a positive percentage, so always check the sign of both inputs before trusting the result.
6. What is the difference between ROE and ROA?
ROE divides net profit by shareholders' equity only, while ROA divides it by all assets, however they are financed. A company with debt will show an ROE higher than its ROA, which is why a high ROE should be checked against debt levels.
7. What are the limits of return on equity?
ROE says nothing about debt, and it can be pushed up by share buybacks, preferred dividends or one-time items rather than better operations. Use it alongside ROA, cash flow and debt ratios for a fuller picture.
Report an issue with this page
Spotted a wrong result or unclear explanation? Report an issue or read our editorial policy.