

APC Calculator: Average Propensity to Consume and Save
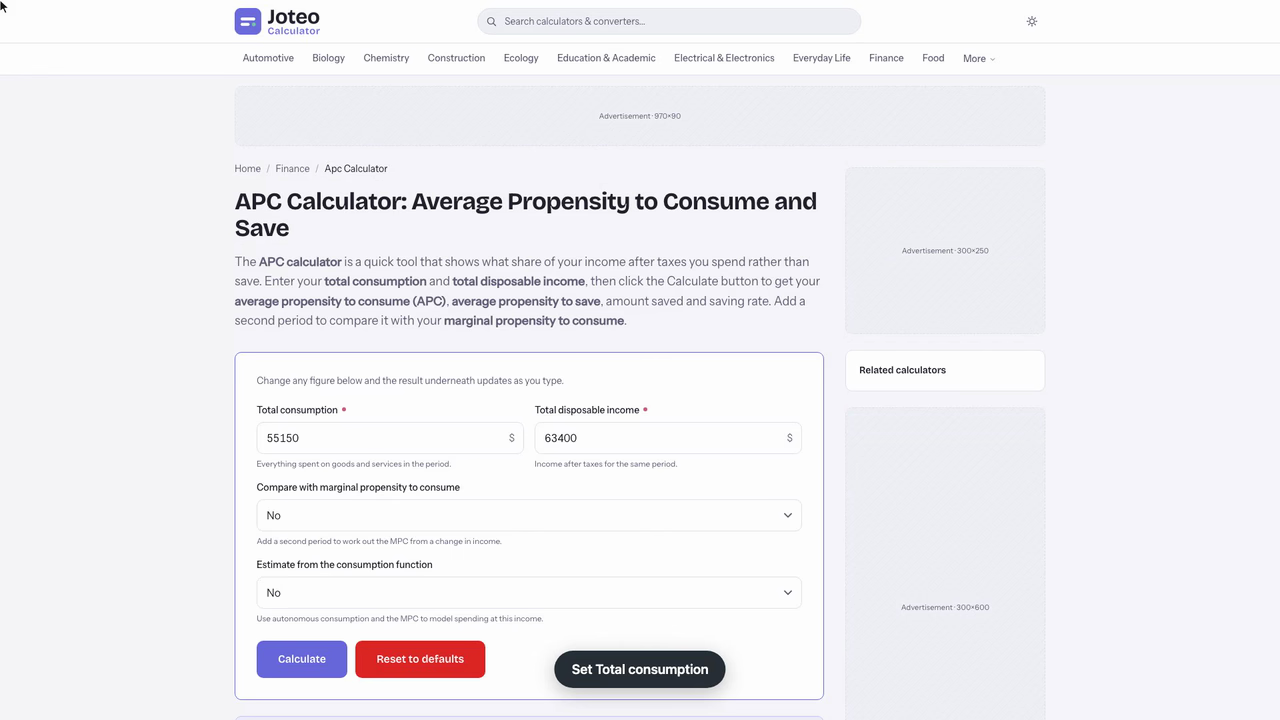
The APC calculator is a quick tool that shows what share of your income after taxes you spend rather than save. Enter your total consumption and total disposable income, then click the Calculate button to get your average propensity to consume (APC), average propensity to save, amount saved and saving rate. Add a second period to compare it with your marginal propensity to consume. Also try the Mps Calculator.
Apc Calculator inputs and result
Average propensity to consume (APC)
—
- Average propensity to save (APS)
- —
- Amount saved
- —
- Share of income spent
- Saving rate
- —
- Marginal propensity to consume (MPC)
- —
- Marginal propensity to save (MPS)
- —
- APC in second period
- —
- Consumption predicted by the consumption function
- —
- APC predicted by the consumption function
- —
Table of contents
Who wrote and checked this page


Ever wondered how much of each paycheck actually stays with you? The APC calculator divides what you spend by your disposable income (what's left after taxes) and returns your average propensity to consume: the proportion of income that goes to consumption instead of being put aside. That one ratio gives your saving rate and a quick check on your spending and saving habits.
What the Average Propensity to Consume Measures
The average propensity to consume (APC) is the share of income a household spends on goods and services over a period, usually a month or a year. It's a level, not a change: it compares everything you spent with everything you had available to spend. An APC of 0.87 means 87 cents of every disposable dollar was spent and 13 cents was kept.
Because necessities like food, rent and transport take a bigger bite out of a small budget, low-income households tend to show a higher APC, while high-income households spend a smaller share even when they spend more dollars. That's why the ratio is often used to study income distribution and consumer behavior across groups.
Typical Consumption Share by Household Income
There's no single "correct" average propensity to consume. Across an economy, consumer spending as a share of income moves with interest rates, confidence and the age of the population. In personal finance, the useful question is how the ratio the calculator returns for you compares with last year's and with the savings goal you've set, not with a national average.
Can an APC Value Above 1 Happen?
Yes. A value above 1 means you spent more than your disposable income, so the gap was covered by drawing on savings, selling assets or choosing to borrow. Students, retirees living on past savings and households hit by a job loss often sit above 1 for a while. A long stretch above 1 usually means growing debt.
APC Formula and the Keynesian Consumption Function
The APC formula is a single division:
$$\text{APC} = \frac{C}{Y_d}$$
where \(C\) is total consumption (all consumption expenditure in the period) and \(Y_d\) is disposable income. Both must cover the same period and be in the same currency. The average propensity to consume formula connects to the Keynesian consumption function, the core idea of Keynesian economics that spending depends mainly on current income.
Autonomous Consumption in the Average Propensity to Consume Formula
If spending follows \(C = C_a + c \times Y_d\), where \(C_a\) is autonomous consumption (autonomous spending that happens even at zero income) and \(c\) is the MPC, the APC breaks into two parts:
$$\text{APC} = \frac{C_a}{Y_d} + c$$
The first term shrinks as income increases, so the APC falls toward the MPC but never below it. Setting APC = 1 gives a break-even income of \(C_a \div (1 - c)\). Below it, the household spends more than it earns.

Worked Example: Running the Numbers Through the APC Calculator
Say your household's disposable income last year was $63,400 and your bank and card statements add up to $55,150 of spending. To calculate APC:
- Enter total consumption: $55,150.
- Enter disposable income: $63,400.
- The apc calculation returns 55,150 ÷ 63,400 = 0.870.

Your APC index is 0.870, so the APS is 1 − 0.870 = 0.130, or $8,250 kept. Now suppose your spending follows a consumption function with $9,502 of spending that doesn't depend on income and an MPC of 0.72. The table shows how the same average propensity to consume calculation moves at other income levels:
| Disposable income | Total consumption | Saving | APC | APS |
|---|---|---|---|---|
| $30,000 | $31,102 | −$1,102 | 1.037 | −0.037 |
| $45,000 | $41,902 | $3,098 | 0.931 | 0.069 |
| $63,400 | $55,150 | $8,250 | 0.870 | 0.130 |
| $90,000 | $74,302 | $15,698 | 0.826 | 0.174 |
| $120,000 | $95,902 | $24,098 | 0.799 | 0.201 |
The break-even income here is 9,502 ÷ 0.28 ≈ $33,936. An average propensity to consume calculator gives you one point on this curve. Rerun it each year to see which way you're heading.

Can We Hit 20%? I Calculate APC From a Year of Bank Statements
Our goal this year is the 20% savings slice of the 50/30/20 budgeting rule, so the question is simple: is our ratio at or below 0.80? The short answer is no. Our average propensity to consume comes out at 0.880, and closing the gap means cutting about $6,060 of yearly spending.
Here's how I get there. I start with twelve months of net pay deposits, which total $71,836, and twelve months of spending from the checking account and two credit cards, which total $66,418. Entered as they are, the calculator returns 66,418 ÷ 71,836 = 0.925. That looks bad, but it's wrong.
The deposits are missing $3,612 that went straight from payroll into a 401(k). That money is still income after tax, and it was saved, not spent. Adding it back gives a denominator of $75,448, and I enter the numbers again:
| Run | Spending | Income used | Result |
|---|---|---|---|
| Deposits only | $66,418 | $71,836 | 0.925 |
| 401(k) added back | $66,418 | $75,448 | 0.880 |
| Card payment counted twice | $68,353 | $75,448 | 0.906 |
| Insurance and streaming cut | $61,548 | $75,448 | 0.816 |
The third row is a mistake I nearly made. One $1,935 transfer from checking paid off a card balance whose purchases I had already counted, so including it double-counts spending. I check this by matching the transfer against the card statement. A careful checking-account export is where most people's figure goes wrong.
To find the target, I solve for spending: 0.80 × $75,448 = $60,358. That's $6,060 less than we spent. Switching car insurance and cancelling three subscriptions saves $4,870, which brings us to 0.816. That's a saving rate of 18.4%, close but not at 20%.
In my view, the number to watch is the income figure, not spending. Pre-tax savings, bonuses paid in a different month, and refunds all move the denominator without changing your habits. I'll rerun this in six months with the same income definition, because a figure is only useful if it's compared like for like.
APC, the Average Propensity to Save and Your Savings Rate
Every disposable dollar is either spent or saved, so the two averages always add up to one:
$$\text{APC} + \text{APS} = 1 \qquad \text{APS} = \frac{S}{Y_d}$$
The average propensity to save is simply your savings rate written as a decimal. If a budget plan sets aside 12% of disposable income, your APC has to come in at 0.88 or lower. Checking it quarterly is a simple way to see whether your spending habits are drifting.
Average Propensity to Consume vs Marginal Propensity to Consume
The APC describes where you are. The marginal propensity to consume (MPC) describes how you react: it's the change in consumption divided by the change in income, \(\text{MPC} = \Delta C \div \Delta Y\). If a $6,400 rise in disposable income lifts spending by $4,608, the MPC is 0.72 for each additional dollar, while the APC drops from 0.870 to 0.856. Pay rises pull the APC down whenever the MPC is lower than the APC, which is how consumption patterns usually shift.
Why Marginal Propensity to Consume and Marginal Propensity to Save Add Up to 1
An extra dollar of income can only be spent or saved, so MPC + MPS = 1. With an MPC of 0.72, the marginal propensity to save is 0.28. The same identity links the averages: APC + APS = 1.
Reading APC and MPC on a Consumption Graph
Plot spending against income and the marginal propensity to consume is the slope of the consumption function, which stays the same along a straight line. The APC is the slope of a line from the origin to your point on it. That ray flattens as you move right, which is why the APC falls while the MPC holds steady.
How Economists Read the Average Consumption Rate
In macroeconomics, the average consumption rate across all households is a key demand signal, since consumer spending is the largest part of GDP. A rising rate often tracks consumer confidence and real wages, while a falling one can come before a recession as households build private savings. Policy design uses it too:
- Tax rebates and tax cuts aimed at high-APC groups get spent faster, which strengthens the multiplier effect.
- When the economy-wide ratio is high, stimulus paid during high unemployment is spent quickly and works through the aggregate consumption function to support economic recovery.
- A falling ratio means more of each dollar is saved. That money can fund investment, but less of it circulates as spending, so economics tracks it alongside the money multiplier.
Disposable Income vs Gross Income When You Track It Yourself
Use disposable income, not gross income. Taxes never reach your account, so dividing by gross pay understates your APC and overstates your savings. Net income after taxes and payroll deductions is the right denominator, and it keeps your figure comparable from year to year as economic growth lifts pay.
FAQs around Apc Calculator
1. Can the average propensity to consume be greater than 1?
Yes. An APC above 1 means spending was larger than disposable income for the period, so the difference came from savings, selling assets or borrowing. It is common for students, retirees and households after a job loss, but a long run above 1 usually means growing debt.
2. What is the difference between APC and MPC?
The APC is total consumption divided by total disposable income, so it describes where you are now. The MPC is the change in consumption divided by the change in income, so it describes how much of the next dollar you spend. Use the second-period option in the calculator to see both.
3. Should I use gross income or disposable income?
Use disposable income, meaning income after taxes. Taxes never reach your account, so dividing by gross pay makes your APC look lower and your saving look higher than it really is. Add back any pre-tax retirement contributions, because that money was saved.
4. Does APC go up when income falls?
Usually. Essential spending doesn't shrink as fast as income, so when disposable income drops, the share spent rises. The reverse also holds: as income rises, autonomous spending is spread over more dollars and the APC falls toward the MPC.
5. How are APC and APS related?
They always add up to 1, because every dollar of disposable income is either spent or saved. If your APC is 0.87, your APS is 0.13, which is the same as a 13% saving rate.
6. Why do economists track the APC?
In macroeconomics, the economy-wide APC shows how much household income turns into demand for goods and services. A rising ratio often goes with stronger consumer confidence, while a falling one can signal households pulling back before a slowdown. It also helps predict how much of a tax rebate or stimulus payment will be spent.
Report an issue with this page
Spotted a wrong result or unclear explanation? Report an issue or read our editorial policy.