

Financial Leverage Ratio Calculator | Equity Multiplier
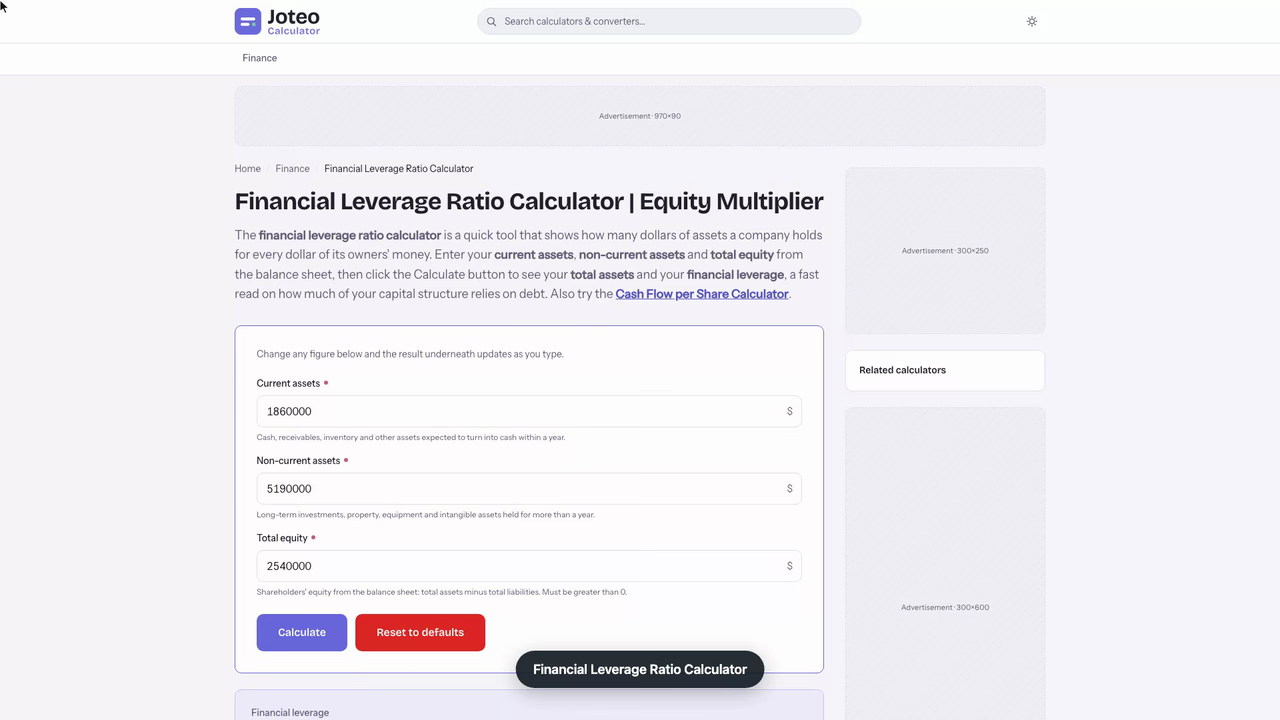
The financial leverage ratio calculator is a quick tool that shows how many dollars of assets a company holds for every dollar of its owners' money. Enter your current assets, non-current assets and total equity from the balance sheet, then click the Calculate button to see your total assets and your financial leverage, a fast read on how much of your capital structure relies on debt. Also try the Apc Calculator.
Financial Leverage Ratio Calculator inputs and result
Financial leverage
—
- Total assets
- —
Table of contents
Who wrote and checked this page


Before you lend to, invest in, or run a company, you want to know how much of what it owns was paid for with borrowed money. The financial leverage ratio calculator answers that in one step: enter current assets, non-current assets and total equity, and you get how many dollars of assets sit on each dollar of equity, a quick read on the leverage risk and debt obligations behind the balance sheet.
How the Financial Leverage Ratio Calculator Works
The tool follows the same three steps an analyst would take with a printed balance sheet. It adds the two asset groups together, takes the equity figure you supply, and divides one by the other. The result is shown as a multiple, such as 2.78x, meaning the company controls $2.78 of assets for every $1 its owners have put in or left in the company.
Because every input comes straight off the balance sheet, you don't need an income statement, a share price or any market data. That makes it one of the fastest solvency checks you can run on a private company, a listed one, or your own firm at the end of a quarter.
Inputs: Current Assets, Non-Current Assets and Total Equity
You fill in three fields:
- Current assets: cash, inventory, receivables and anything else expected to turn into cash within twelve months.
- Non-current assets: long-term investments, buildings, vehicles, equipment and intangible assets held for more than a year.
- Total equity: common stock, preferred stock, paid-in capital and retained earnings, less any accumulated losses.
If your balance sheet already shows total assets as one line, you can enter that figure as current assets and leave the second field at zero; the answer is the same.
Reading the Leverage Ratio as an Equity Multiplier
The output goes by a second name, the equity multiplier, and some textbooks call it the assets-to-equity ratio. All three names describe one number. A multiplier of 1.0 means the owners funded every asset themselves. Anything above 1.0 is the share of assets funded by creditors and suppliers instead. Think of it as a solvency ratio: the higher it climbs, the thinner the cushion of owner money standing between the company and its creditors if asset values fall.
The Financial Leverage Formula, Step by Step
The financial leverage ratio formula is a single division:
$$\text{Financial Leverage} = \frac{\text{Total Assets}}{\text{Total Equity}}$$
and total assets are simply the two asset groups combined:
$$\text{Total Assets} = \text{Current Assets} + \text{Non-Current Assets}$$
Since assets always equal liabilities plus equity, you can rewrite the same idea as \(1 + \frac{\text{Liabilities}}{\text{Equity}}\). That second form shows why the ratio can never fall below 1.0 for a solvent company: the liabilities part can shrink to zero, but it can't go below it.
Total Assets on the Balance Sheet
Most published statements print total assets near the bottom of the asset column. Use the figure from the same date as the equity figure; mixing a year-end asset total with a mid-year equity total produces a ratio that describes no real moment in the company's life. For seasonal businesses, such as a retailer carrying heavy inventory before the holidays, you may want to average the opening and closing balances.
Total Liabilities and Shareholders' Equity
Total equity is what remains after subtracting total liabilities from total assets. It's also reported as shareholders' equity, stockholders' equity or net worth. For a small business run as a sole proprietorship, the same line is usually labelled owner's capital. Whatever the label, it is the residual claim the owners would keep if every creditor were paid in full.
Worked Example: A Regional Food Distributor
Say you are reviewing a regional food distributor with this balance sheet:
| Line item | Amount |
|---|---|
| Current assets | $1,860,000 |
| Non-current assets | $5,190,000 |
| Total assets | $7,050,000 |
| Total equity | $2,540,000 |
| Total liabilities | $4,510,000 |
Step through it:
- Add the asset groups: $1,860,000 + $5,190,000 = $7,050,000.
- Take equity from the balance sheet: $2,540,000.
- Divide: \( \frac{7{,}050{,}000}{2{,}540{,}000} = 2.78 \). The distributor's financial leverage is 2.78x.
Read that result the other way round and it becomes more concrete. Liabilities of $4,510,000 fund 64.0% of the assets, while the owners' $2,540,000 funds the remaining 36.0%. For every dollar of equity, the company carries about $1.78 of liabilities.

How to Interpret Financial Leverage Ratios
A higher multiple means more of the asset base is borrowed, which raises financial risk. It also magnifies results in both directions. When profit is strong, a small equity base earns a high return on investment for the owners. When profit slips, the same fixed interest and repayment schedule eats a larger share of cash, and the company's financial health can deteriorate quickly.
The link to returns is exact. In the DuPont breakdown, return on equity equals return on assets multiplied by the equity multiplier. If the food distributor earns a 5.4% return on assets, its return on equity is \(5.4\% \times 2.78 = 15.0\%\). Cut leverage to 1.5x and the same operations would earn owners only about 8.1%.
What Is a Good Financial Leverage Ratio?
No single number is "good" for every company. The table below turns common multipliers into the share of assets funded by debt and other liabilities, which is often an easier way to judge them:
| Financial leverage | Share of assets funded by liabilities | Liabilities per $1 of equity | Typical reading |
|---|---|---|---|
| 1.00x | 0% | $0.00 | No debt at all; very conservative |
| 1.25x | 20% | $0.25 | Light borrowing |
| 2.00x | 50% | $1.00 | Equal debt and equity |
| 2.78x | 64% | $1.78 | Our food distributor |
| 4.00x | 75% | $3.00 | Heavy borrowing; covenants tighten |
| 6.00x | 83% | $5.00 | High risk outside banking and utilities |
| 10.00x | 90% | $9.00 | Normal only for banks and other deposit takers |
Notice that the step from 1.25x to 2.00x adds 30 points of borrowed funding, while the step from 6.00x to 10.00x adds only 7. Past about 4x, each extra turn of leverage changes the debt share very little but shrinks the equity cushion dramatically.

Why Financial Leverage Varies by Industry
Capital intensive sectors such as utilities, airlines and telecommunication networks borrow heavily because their assets are long-lived and their revenue is steady enough to support fixed repayments. Banks run far higher multiples because lending borrowed money is their business. Insurance companies, on the other hand, face regulatory capital rules that limit how far they can lean on debt. That's why a ratio only means something when you compare it with peers in the same industry, ideally companies of similar size and model.
Can Financial Leverage Be Negative?
Only if equity is negative, which happens when accumulated losses or large buybacks leave liabilities larger than assets. In that case the formula returns a negative number that shouldn't be read as "low leverage". It signals that owners have no cushion left, a situation that can raise questions about the business continuing as a going concern and, in the worst case, bankruptcy. Treat a negative result as a red flag, not a rating.
Other Leverage Ratios Compared
The equity multiplier is one member of a family. Other leverage ratios swap the numerator or the denominator to answer a slightly different question. Here are the ones you will see most often, with the food distributor's own figures (interest-bearing debt of $3,150,000, cash of $410,000, EBITDA of $1,020,000, EBIT of $780,000 and interest expense of $214,000):
| Ratio | Formula | Food distributor |
|---|---|---|
| Financial leverage (equity multiplier) | Total assets ÷ total equity | 2.78x |
| Debt-to-equity ratio | Total debt ÷ total equity | 1.24x |
| Debt-to-assets ratio | Total debt ÷ total assets | 0.45x |
| Debt-to-capital ratio | Total debt ÷ (total debt + total equity) | 0.55x |
| Debt-to-EBITDA | Total debt ÷ EBITDA | 3.09x |
| Net debt-to-EBITDA | (Total debt − cash) ÷ EBITDA | 2.69x |
| Interest coverage ratio | EBIT ÷ interest expense | 3.64x |
The first four are balance-sheet measures of capital structure, the mix of debt and equity financing behind the assets. The last three compare borrowing with earnings, which tells you whether the company can actually service what it owes.
Debt Ratio and the Debt-to-Equity Ratio vs. the Equity Multiplier
The debt ratio and the debt-to-equity ratio usually count only interest-bearing debt, while the equity multiplier counts every liability, including supplier invoices, wages owed and deferred tax. That's why the food distributor shows 1.24x on debt-to-equity but 1.78 of total liabilities per dollar of equity. Neither is wrong; they simply draw the line around "borrowing" in different places. When you compare companies, use the same ratio for all of them.
Debt-to-EBITDA Ratio and Cash Flow Leverage
The debt-to-EBITDA ratio asks how many years of operating earnings it would take to clear the debt. Credit analysts often call this "the" leverage ratio because it links borrowing to cash generation rather than to asset values. Common cash-flow versions include:
- Total debt-to-EBITDA: total debt divided by EBITDA, the headline figure in most credit agreements.
- Net debt-to-EBITDA: total debt minus cash, divided by EBITDA, useful when a company holds large cash reserves.
- Senior debt-to-EBITDA: only the debt ranked first for repayment, divided by EBITDA.
- Total debt-to-(EBITDA − capex): a stricter test that subtracts the capital spending needed to keep assets working.
- Free cash flow to total debt: the share of debt that one year's free cash flow could repay.
None of these replaces the equity multiplier the calculator returns; they sit beside it. The calculator tells you how much of the asset base is borrowed, and these tell you whether earnings can carry that borrowing. A company can look moderate on the balance sheet and stretched on cash flow, or the reverse, so the two views work best together.
Testing a 3.5x Bank Covenant with a Financial Leverage Check
A dentist who owns a three-location practice group is weighing a $418,600 loan for two cone-beam imaging units. The bank's term sheet includes one condition that matters more than the rate: the practice's total assets divided by its equity may not exceed 3.5x at any quarter-end. Before signing, she opens the June 30 balance sheet her bookkeeper sent over. See also our Mps Calculator.
She types in the three figures exactly as printed:
- Current assets: $612,380 (cash, insurance receivables and dental supplies on hand)
- Non-current assets: $1,947,215 (chairs, existing imaging, leasehold improvements)
- Total equity: $803,470
The calculator adds the assets to $2,559,595 and returns a financial leverage ratio of 3.19x. Today the practice clears the covenant, with liabilities funding 68.6% of its assets.
Then she reruns it as if the loan had closed. The new equipment adds $418,600 to non-current assets, and the loan adds the same amount to liabilities, while equity doesn't move. Total assets become $2,978,195, and the multiple jumps to 3.71x, above the 3.5x ceiling on day one.
That single figure reframes the decision. She works out two ways back under the line:
- Borrow no more than $252,550, which lands exactly at 3.50x and leaves no margin for a weak quarter.
- Keep the full loan but put $70,000 of her own cash into the practice as new equity, which brings the multiple to 3.49x.
She emails the bank to ask whether the covenant is tested on the first quarter-end after funding or on the closing date, because the answer decides whether the $70,000 injection has to arrive before the loan does.
Converting One Leverage Ratio into Another
If you only have one of these numbers, you can often derive the others. When liabilities are treated as the "debt" in each ratio, the relationships are exact:
$$\frac{\text{Liabilities}}{\text{Equity}} = \text{Financial Leverage} - 1$$
$$\frac{\text{Liabilities}}{\text{Assets}} = 1 - \frac{1}{\text{Financial Leverage}}$$
So a multiplier of 2.78x gives 1.78 of liabilities per dollar of equity and 1 − 1 ÷ 2.78 = 64.0% of assets funded by liabilities, exactly what the worked example showed. This leverage ratio formula shortcut is handy when a report gives you one ratio and a lender's covenant is written in another.

- Equity multiplier to liabilities-to-equity: subtract 1.
- Equity multiplier to liabilities-to-assets: divide 1 by the multiplier and subtract the answer from 1.
- Liabilities-to-assets back to the equity multiplier: divide 1 by (1 minus that share).
Financial Leverage, Credit Risk and Default Risk
Credit risk is the chance that a lender isn't repaid in full and on time. Default risk is the narrower chance that the borrower misses a scheduled interest or principal repayment outright. Rising leverage pushes both up, because a larger debt burden leaves less room for a bad year. Rating agencies weigh this heavily, especially when a company's capital structure shifts after an acquisition funded mostly by borrowing: a jump in leverage can lower a company's credit rating, which raises the rate it pays on new loans and corporate bonds. You might also find our Dividend Payout Ratio Calculator useful.
Loan Covenants and Maintenance Covenants
Lenders rarely rely on trust alone. Most credit agreements include loan covenants that cap how far leverage can climb. Common types include:
- Maintenance covenants: tested every quarter, for example "total debt to EBITDA may not exceed a set multiple".
- Incurrence covenants: tested only when the borrower takes an action such as raising new debt, paying dividends or buying back stock.
- Minimum net worth tests: require equity to stay above a fixed dollar amount, which indirectly caps the equity multiplier.
Breaking a covenant can trigger penalty fees, higher interest or a demand for immediate repayment, so finance teams track their leverage ratio against these limits well before each test date.
Borrowed Versus Owner Funding and the Tax Shield
Debt is usually cheaper than equity. Creditors rank ahead of owners, so the cost of debt sits below the cost of equity, and interest expense is tax-deductible in most jurisdictions, creating a tax shield that lowers the company's tax bill. That's the case for some debt financing, and it's why a multiple above 1.0x can be a sensible choice. The catch is that every step up in the equity multiplier, say from 2x to the food distributor's 2.78x, captures more of that tax saving but raises the risk profile for both lenders and shareholders, so past a certain point both the cost of debt and the cost of equity start to climb. The goal is not the lowest multiple the calculator can show but the one that balances cheaper funding against rising earnings volatility.
How a Business Can Improve Its Leverage Ratio
"Improve" depends on where you start. A company that's too stretched wants to bring the multiple down; a company with no borrowing at all may be leaving returns on the table. Once you calculate financial leverage for your own business, the levers below show which way each decision moves the number.
Lowering Leverage
- Keep profits as retained earnings instead of paying them out, which grows equity.
- Raise new equity capital by selling shares to investors.
- Use spare cash flow to pay down debt ahead of schedule.
- Sell under-used assets and repay borrowing with the proceeds.
Raising Leverage on Purpose
A business with steady revenue and unused debt capacity may borrow to buy equipment or another company, lifting the multiple while boosting returns to owners. The test is whether the new assets earn more than the interest they cost. Borrowing to fund growth that pays back quickly is very different from borrowing to cover operating losses. Before signing, rerun the ratio with the new loan added to liabilities and the new asset added to the non-current total, then check the projected multiple against any covenant ceiling and against the peer range you use for comparison. If the projected figure lands above both, a smaller loan or a partial equity raise is usually the safer path.
Using Financial Leverage Ratios in Investment Decisions
For investors, financial leverage ratios are a screening tool rather than a verdict, and they work best next to measures of profitability such as operating margin and return on assets. They flag which companies depend most on debt capital, but they don't tell you whether that debt is well spent. Useful habits include:
- Compare the leverage ratio with at least three peers in the same industry.
- Look at the trend over three to five years; a steadily rising ratio matters more than one high reading.
- Check a cash-flow ratio alongside it, so you know whether earnings can carry the debt.
- Read the notes for leases and other obligations that may sit outside the headline debt figure.
Used this way, the financial leverage ratio calculator gives you a fast first pass, and the other leverage ratios above help you decide whether a high number reflects a deliberate, well-funded strategy or a balance sheet heading for trouble.
FAQs around Financial Leverage Ratio Calculator
1. What is a good financial leverage ratio?
There is no single good number. A ratio near 1.0 means almost no borrowing, around 2.0 means debt and equity fund the assets equally, and much above 4.0 is heavy outside banking and utilities. Always compare the result with companies in the same industry.
2. Can financial leverage be negative?
Only when total equity is negative, which happens when liabilities exceed assets after large losses or buybacks. A negative result is not low leverage; it means the owners have no cushion left, so treat it as a warning sign.
3. Is financial leverage the same as the equity multiplier?
Yes. Total assets divided by total equity is called the financial leverage ratio, the equity multiplier or the assets-to-equity ratio. It is also the leverage term in the DuPont breakdown of return on equity.
4. What is total equity?
Total equity is what remains when total liabilities are subtracted from total assets. It includes common and preferred stock, paid-in capital and retained earnings, and it is the amount owners would keep if every creditor were repaid.
5. What is the difference between current and non-current assets?
Current assets are expected to be used or turned into cash within a year, such as cash, receivables and inventory. Non-current assets are held for longer, such as buildings, equipment, long-term investments and patents.
6. How does financial leverage relate to the debt-to-equity ratio?
If you count all liabilities as debt, liabilities divided by equity equals financial leverage minus 1. A 3.0x multiplier means $2 of liabilities for every $1 of equity. Ratios that count only interest-bearing debt will come out lower.
7. How can a company lower its financial leverage?
Keep more profit as retained earnings, raise new equity, repay debt from spare cash flow, or sell under-used assets and use the proceeds to pay down borrowing. Each step either grows equity or shrinks assets funded by debt.
Report an issue with this page
Spotted a wrong result or unclear explanation? Report an issue or read our editorial policy.