

Free Cash Flow Calculator: Find FCF From Cash Flow
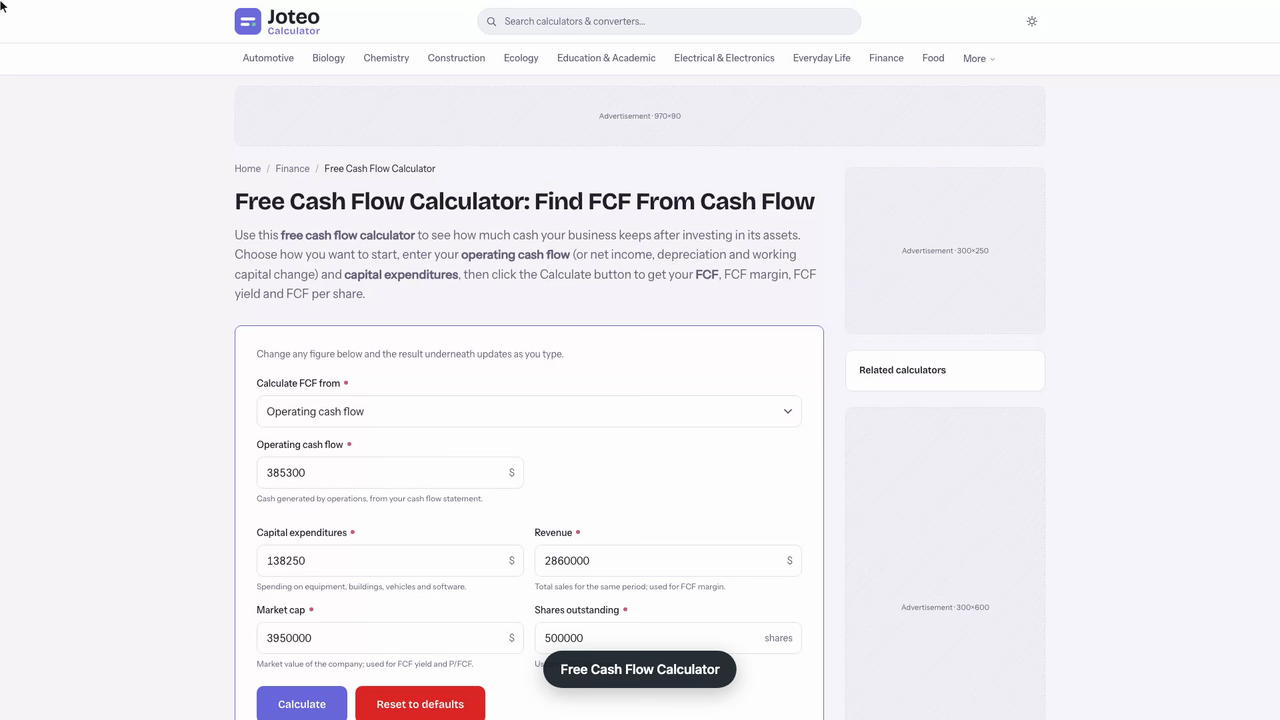
Use this free cash flow calculator to see how much cash your business keeps after investing in its assets. Choose how you want to start, enter your operating cash flow (or net income, depreciation and working capital change) and capital expenditures, then click the Calculate button to get your FCF, FCF margin, FCF yield and FCF per share. Also try the Receivables Turnover Calculator.
Free Cash Flow Calculator inputs and result
Free cash flow (FCF)
—
- Operating cash flow used
- —
- FCF margin
- —
- FCF yield
- —
- FCF per share
- Price to FCF (P/FCF)
- —
Table of contents
Who wrote and checked this page


Use this free cash flow calculator to see the cash flow generated by your business once it has paid for the assets it needs to keep running. Enter what your operations produce and what you spent on capital expenditures, and you get FCF, FCF margin and FCF yield: the cash left for payroll, accounts payable, loan payments and other obligations.
How to Calculate Free Cash Flow From Your Financial Statements
To work out your FCF, start with the cash your operations generate and subtract what you invest to keep them going.
$$\text{FCF} = \text{Operating Cash Flow} - \text{Capital Expenditures}$$
Operating Cash Flow and Capital Expenditure
Operating cash is what your business collects from sales after paying expenses and tax. Capex is money spent on equipment, buildings, vehicles and software that you use for years. Growth capex expands the company; maintenance capex only keeps it running.
Net Income, Depreciation and Working Capital
Does your business lack an operating figure? Rebuild it from your income statement and balance sheet. Start with earnings, add back non-cash charges such as depreciation and stock-based compensation, then subtract any rise in assets tied up in day-to-day trading.
\(\text{FCF} = \text{Net Income} + \text{Depreciation} - \Delta\text{Working Capital} - \text{CapEx}\)
Free Cash Flow Calculator Worked Example
Take a small manufacturer with $2,860,000 of revenue, a $3,950,000 market cap and 500,000 shares. Its inputs and results look like this.
| Line | Amount |
|---|---|
| Net income | $241,800 |
| Depreciation | $164,500 |
| Increase in working capital | −$21,000 |
| Cash from operations | $385,300 |
| Capital expenditure | −$138,250 |
| FCF | $247,050 |
That is an FCF margin of 8.6%, so the firm keeps about 8.6 cents per dollar of sales. Against its market cap, the FCF yield is 6.3%, and FCF per share is $0.49.

When Free Cash Flow Misleads
One year can fool you. A new factory makes a strong company look cash-poor, while a late payroll run or a bumper collection of receivables inflates the result through working capital timing. Judge earnings quality over a 5-year trend: lumpy but rising positive FCF beats a flat line.
Checking Loan Cover With the FCF Calculator for a Coffee Roaster
Dana runs a small coffee roastery and wants a $240,000 loan for a bigger roaster. The bank asks for FCF of at least 1.25 times the yearly loan payments, so the question is simple: does the roastery clear that bar? See also our Apc Calculator.
From last year's books, Dana enters cash from operations of $118,420 and capital expenditure of $46,900, then revenue of $842,600. The calculator returns FCF of $71,520, an 8.5% margin. At 8.4% over seven years the loan costs $3,788.70 a month, or $45,464 a year, so cover, with the calculator's FCF as the numerator, is 71,520 ÷ 45,464 = 1.57 times. That clears 1.25, which I would call a comfortable pass.
Then comes the cross-check. Reading the receivables line, Dana spots a one-time $19,300 collection from an old wholesale account. Rerunning without it:
| Case | FCF | Cover |
|---|---|---|
| As reported | $71,520 | 1.57× |
| Without the one-time collection | $52,220 | 1.15× |
The same business now falls short of 1.25×. The input to watch is the cash from operations, because one lumpy receivable moved the answer more than any rate change would.
The named next step is to size the loan to the cleaner figure: $52,220 ÷ 1.25 leaves about $41,776 a year for payments, which supports a loan of roughly $220,000 rather than $240,000. One caveat: this FCF is measured before loan payments, so subtracting them again would double count. A calculator result like this should not be trusted alone when capex is lumpy, because a skipped repair year flatters it. Dana averages three years of capital spending before talking to the bank.
FCF Margin, FCF Yield and Stock Valuation
Investors and analysts lean on these ratios because they compare firms of different size. Each industry sets its own benchmark, so software companies usually post higher margins than retailers or industrials. You might also find our Nopat Calculator useful.
Free Cash Flow vs. EBITDA
EBITDA ignores capital spending, so a capital-hungry company can look rich on it while FCF stays thin. FCF is the stricter, cash-based test.
What Is a Good FCF Margin?
There is no universal cutoff. A margin above 10% is comfortable for many firms, yet a lower figure can be fine for a distributor with thin pricing, as long as it holds steady year after year. Compare your margin with direct peers and with your own history rather than with a headline number.
FCF per Share and P/FCF
Divide FCF by shares outstanding to get FCF per share, then divide the share price by it for the P/FCF multiple. A lower multiple means you pay less for each dollar of cash, which is the logic behind a high FCF yield. The two measures are the same idea turned upside down, so use whichever your comparison table already carries.

Owner Earnings vs. Accounting Earnings
Reported profit depends on accounting choices: depreciation schedules, one-off write-downs and when revenue is recognised. Cash is harder to bend. That is why Warren Buffett favours owner earnings, the cash an owner could take out each year without weakening the company's competitive position. Two businesses can report the same profit after tax and have very different cash.
From FCF to Intrinsic Value
Every DCF starts with projected FCF, using discounted cash flow at the WACC. A P/FCF ratio works like P/E for stock valuation. Cutting the discount rate or raising the growth estimate lifts the answer fast, so test both. Positive FCF lets a company self-fund growth, pay dividends to shareholders and cut debt without new financing from a bank. Treat it as one investment input to your financial planning, not the only one.
FAQs around Free Cash Flow Calculator
1. What is free cash flow?
Free cash flow (FCF) is the cash a business generates from operations after paying for the capital expenditures needed to maintain or grow its assets. It is the money available for debt repayment, dividends or reinvestment.
2. How do you calculate free cash flow?
Subtract capital expenditures from operating cash flow. If you lack operating cash flow, build it from net income plus depreciation and amortization, minus any increase in working capital.
3. What is a good FCF margin?
FCF margin is FCF divided by revenue. Healthy levels vary widely by industry, so compare your figure with direct peers and your own multi-year history rather than one universal number.
4. What is the difference between FCF and EBITDA?
EBITDA ignores capital expenditures and working capital, so it can overstate cash generation in capital-intensive businesses. FCF subtracts capex and is a stricter cash-based measure.
5. Can free cash flow be negative?
Yes. A company that is investing heavily in new equipment or growth can show negative FCF for a period. Look at several years of data to tell investment from real cash trouble.
6. What is FCF yield?
FCF yield is FCF divided by market cap. It shows how much free cash a company produces per dollar of its market value, so a higher yield suggests a cheaper stock, all else equal.
7. Why is free cash flow often preferred over net income?
Net income depends on accounting choices such as depreciation schedules and revenue timing. Cash flow is harder to distort, so FCF gives a clearer view of what the business can actually pay out or reinvest.
Report an issue with this page
Spotted a wrong result or unclear explanation? Report an issue or read our editorial policy.