

Accounts Receivable Turnover Ratio Calculator (Receivables Turnover Ratio)
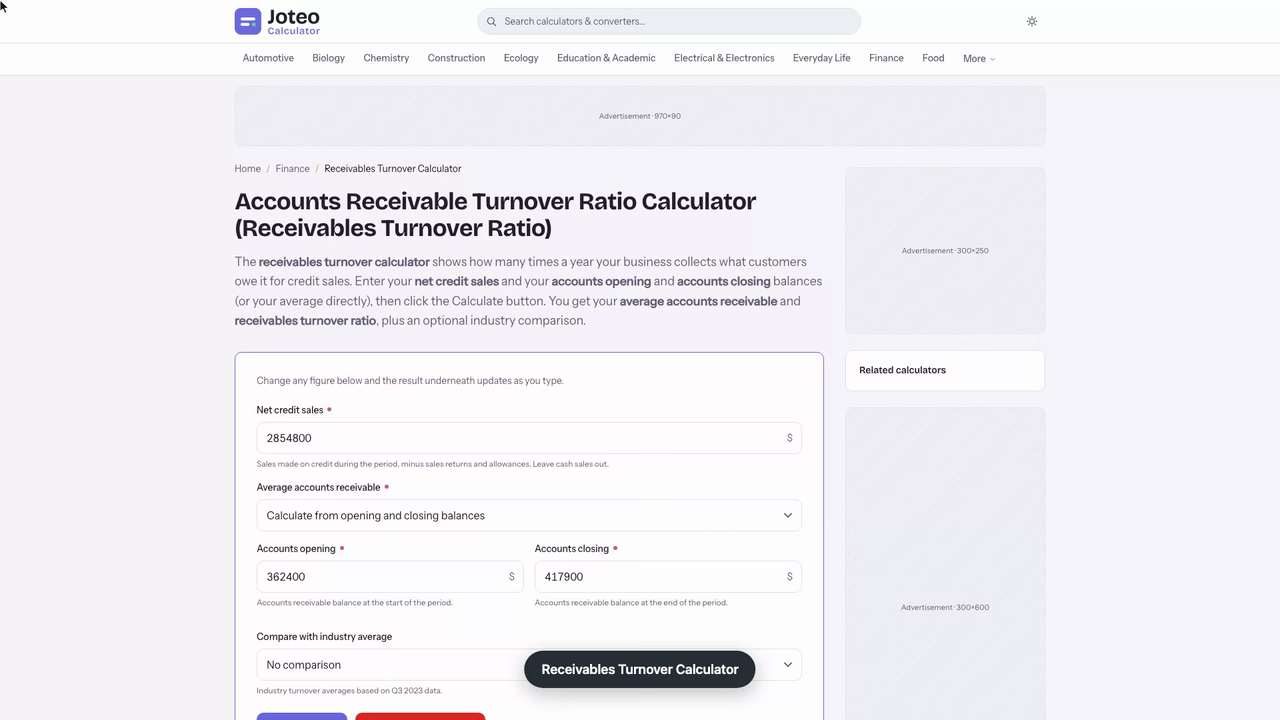
The receivables turnover calculator shows how many times a year your business collects what customers owe it for credit sales. Enter your net credit sales and your accounts opening and accounts closing balances (or your average directly), then click the Calculate button. You get your average accounts receivable and receivables turnover ratio, plus an optional industry comparison. Also try the Altman Z Score Calculator.
Receivables Turnover Calculator inputs and result
Receivables turnover ratio
—
- Average accounts receivable
- —
- Industry average turnover
- —
- Your ratio vs. industry
- —
Table of contents
Who wrote and checked this page


Your customers bought on credit, and the real question is how fast that money comes back to you. The receivables turnover calculator divides net credit sales by average accounts receivable to give you a turnover ratio: the number of times a year your open balances become cash payments. Finance teams and owners use it to check whether annual credit sales are turning into money in the bank or piling up as IOUs.
How to Use the Receivables Turnover Calculator
The tool needs three figures, all of which come straight from your company's accounting or bookkeeping records. Net credit sales comes from the income statement; the two balances come from the balance sheet at the start and end of the period. Some sites call this a receivables revenue calculator, but the math is identical for any business that sells on account.
- Enter net credit sales for the period.
- Enter accounts opening and accounts closing balances for the same period.
- Read the average accounts receivable and your accounts receivable turnover result.
The receivables turnover ratio calculator then shows the receivables turnover ratio as a multiple, such as 7.3x.
Net Credit Sales for the 12-Month Period
Use the total your company sold on credit over a 12-month period, usually your fiscal year, minus returns and allowances. Leave cash sales out completely: a buyer who paid at the counter never created a receivable, so adding that revenue to the numerator inflates the result and hides slow collections.
Average Accounts Receivable From Accounts Opening and Accounts Closing
The opening figure is the balance owed to you on day one; the closing figure is the balance at year-end. Averaging the beginning and ending accounts receivable, (opening + closing) ÷ 2, gives the denominator. Some guides call it average accounts receivables. If balances swing during the year, average the twelve month-end balances for a fairer figure.
Accounts Receivable Turnover Ratio Formula, Step by Step
The accounts receivable turnover ratio formula is one division, a financial ratio that compares credit sales with the money still owed to you:
$$\text{Receivables Turnover} = \frac{\text{Net Credit Sales}}{\text{Average Accounts Receivable}}$$
$$\text{Average AR} = \frac{\text{Opening AR} + \text{Closing AR}}{2}$$
The receivables turnover ratio formula returns a multiple, not a percentage, so you can compare one company with another regardless of size. A higher receivable turnover ratio means each dollar of credit you extend comes back as cash more times per year.
Removing Sales Returns and Allowances First
Start from total credit sales, then subtract sales returns (goods sent back) and sales allowances (price cuts granted after the sale). Skip this step and you overstate the numerator: if returns or allowances run at 2% of sales, your ratio is overstated by roughly the same 2%.
Worked Example for a Wholesale Supplier
A building-supply wholesaler, a family business with about 140 trade accounts, closes its year with the figures below. The company averages $390,150 in accounts receivable, so its accounts receivable turnover ratio is $2,854,800 ÷ $390,150 = 7.32.
| Line item | Amount |
|---|---|
| Total credit sales | $2,915,000 |
| Less returns | $41,500 |
| Less sales allowances | $18,700 |
| Net credit sales | $2,854,800 |
| Opening receivables | $362,400 |
| Closing receivables | $417,900 |
| Average accounts receivable | $390,150 |
| Receivable turnover | 7.32x (about 49.9 days) |
In plain terms, the company turns what customers owe it into cash about 7.3 times a year, or once every 49.9 days.

What the Receivables Turnover Ratio Tells You
Treat it as an activity ratio: it measures how hard the money you are owed is working. Some lenders call the same number the receivables revenue ratio. A credit sale is revenue whose payment is deferred, so every dollar sitting in outstanding receivables is cash your company has earned but cannot spend. As a financial metric, the accounts receivable turnover ratio tracks the efficiency with which you collect payments from customers and clear outstanding debts.
Readers weigh it differently. Creditors and lenders watch for a falling ratio because it raises the risk that customers default, which limits how much they will advance against your receivables. Investors and analysts compare it year over year as a proxy for the creditworthiness of the buyers you sell to.
What a High Turnover Ratio Signals
A high turnover ratio usually means strong liquidity: bills are paid quickly, cash on hand stays healthy and more free cash flows are left for the business. It can also reveal overly strict credit policies that turn away good buyers. A low turnover ratio points to lenient credit policies, weak credit and collection policies, or customers who are struggling to pay.
Checking a Cleaning Contractor's Collection Period With the Turnover Ratio
I'm closing the books for a commercial cleaning contractor that wants a revolving credit line, and the lender's term sheet asks for collections of 45 days or less on net-30 invoices. Before sending anything, I want to know which side of that line we sit on. The answer, once one distortion is removed: 7.68 turns a year, or 47.6 days, still short of the 45-day mark. See also our Financial Leverage Ratio Calculator.
The inputs come straight from the general ledger. Gross billings on account for the year are $1,396,110, and I subtract $9,870 of service credits issued for missed visits, giving net credit sales of $1,386,240. Receivables opened the year at $173,615 and closed at $248,930.
The first run gives an average balance of $211,272.50 and a receivables turnover ratio of 6.56, which converts to 55.6 days. That looks bad, but the closing figure includes a $61,300 deep-clean contract billed on December 28 that no customer could have paid within three days. Rerunning with that invoice moved to January is a fairer picture of how fast clients actually pay:
| Run | Closing AR | Average AR | Turnover | Days |
|---|---|---|---|---|
| As booked | $248,930 | $211,272.50 | 6.56x | 55.6 |
| Late invoice moved to January | $187,630 | $180,622.50 | 7.68x | 47.6 |
I cross-check by hand: 365 ÷ 7.675 = 47.56 days, which matches. Then I solve backward: to hit 45 days with the same sales and opening balance, the average would need to be about $170,906, which means a closing balance near $168,200, roughly $19,400 less than the adjusted figure.
My judgement: the input to watch is the closing balance, not sales. A two-point average built from a single year-end snapshot swings hard on one large invoice, so the honest number for the lender is the average of twelve month-end balances, with the December spike explained in a note. The next step is concrete: chase the three accounts over 60 days, which together hold about $22,000, before the lender's review date, then rerun the calculation with the new month-end figure.
What Is a Good Accounts Receivable Turnover? Industry Averages
There is no single good number; a healthy accounts receivable turnover depends on the payment terms customary in your sector. A quick test is to translate your terms into an implied ratio: net-30 terms paid on time imply about 12 turns a year (365 ÷ 30), and net-60 terms about 6. Compare your result with industry benchmarks for your sector and with your own prior years, not with a generic figure.

Benchmarking Retail, Software, Manufacturing and Construction
Benchmarking only works against peers with similar terms. Retail sellers post very high ratios because few sales are on account. Software firms billing annual subscriptions upfront tend to sit high too, while manufacturing suppliers on net-45 or net-60 terms land lower, and construction firms waiting on progress billings and retainage are often lower still.
Converting the Ratio to AR Turnover Days and DSO
Most finance managers find days easier to picture than a multiple, because the company's invoice terms are quoted in days too. Divide 365 by the ratio to get AR turnover days, also called receivables turnover in days, the average collection period, or days sales outstanding (DSO):
$$\text{AR Turnover Days} = \frac{365}{\text{AR Turnover Ratio}}$$
For the wholesaler, 365 ÷ 7.32 = 49.9 AR turnover days. If its bills carry net-30 terms, customers are paying about 20 days late on average, a gap the multiple alone does not make obvious. Tracking AR turnover every month gives you an early read on cash flow and cash conversion.

Why High AR Turnover Days Strain Working Capital
Every extra day of collection ties up working capital. With $2,854,800 of credit sales a year, the wholesaler books about $7,821 per day, or roughly $237,900 in monthly credit sales. Cutting AR turnover days from 49.9 to 40 would release about $77,400 of cash flow, money for operations and growth that no longer needs borrowing, and it makes cash flow forecasting far more reliable.
How to Improve Your A/R Turnover Ratio
Raising your A/R turnover means shortening the time between delivery and payment, which improves cash flow without new borrowing. Three groups of collection efforts do most of the work for any business.
Invoicing, Payment Options and Early Payment Discounts
- Send invoices the day goods ship; slow invoicing adds days before the customer's clock even starts.
- Offer more payment options, such as ACH, card and online portals.
- Price early payment discounts carefully: 2/10 net 30 costs about 37% a year in annualized terms.
- Print the due date and late fees on every bill.
- Invoice factoring lifts the accounts receivable turnover only because the sold balances leave your books, not because collection improved.
Credit Limits, Checks and Payment Terms
Run credit checks before granting credit terms, set credit limits from each account's payment history, and review them yearly. A written credit policy stops sales staff from promising longer payment terms to close a deal. For a valuable customer in a tight spot, a structured payment plan beats an open-ended balance.
A Clear Collection Process and AR Automation
Write down a collection process: automated reminders before and after the due date, a dunning sequence that escalates by age, phone calls for slow-paying customers, and a collection agency as the last step. AR automation tools tie these collection procedures into the order-to-cash workflow, matching outstanding invoices to incoming payments automatically, which makes collecting payments faster and keeps your collection policies consistent. Each step pulls the closing balance down, and a lower average balance is exactly what lifts the calculator's result: trimming the wholesaler's average from $390,150 to $330,000 moves it from 7.32 to about 8.65 turns a year.
Limitations of Collection Efficiency Ratios
Any collection efficiency ratio is an average across your whole customer base, so at a company with one large slow payer, that single account can drag it down while dozens of small accounts pay on time. It also smooths over collection cycles within the year and says nothing about which balances are at risk.
Bad Debt and Write-Offs
When a company writes off bad debt, it shrinks receivables and the ratio looks better overnight, even though nothing was collected. Read the ratio next to write-offs: if bad debts rose in the same year the ratio improved, the gain may be a write-off effect rather than better collection.
Seasonal Variations and the Aging Report
Seasonal variations distort the average: a toy wholesaler measured on a December closing balance looks very different from one measured in June. For account-level detail, run an aging report; accounts receivable aging shows which customers are 30, 60 or 90+ days past due, something no single ratio can show.
FAQs around Receivables Turnover Calculator
1. What does the receivables turnover ratio measure?
It measures how many times during a period, usually a year, a business collects its average accounts receivable balance. It shows how quickly credit sales turn into cash.
2. How is the accounts receivable turnover ratio calculated?
Divide net credit sales by average accounts receivable. Average accounts receivable is the opening balance plus the closing balance, divided by 2.
3. Is a higher or lower receivables turnover better?
Higher is generally better because customers are paying faster. A very high ratio can also mean your credit terms are so strict that they turn away good customers, so compare it with your industry and your own history.
4. What is a normal receivables turnover ratio?
It depends on the payment terms common in your industry. Businesses that sell mostly for cash or on short terms post high ratios, while manufacturing and construction firms with longer terms usually post lower ones.
5. How do I convert the turnover ratio into days?
Divide 365 by the ratio. The result is the average number of days it takes to collect a receivable, also called days sales outstanding or the collection period.
6. What does a declining receivables turnover ratio mean?
Customers are taking longer to pay. It can point to looser credit terms, collection problems or customers in financial difficulty, and it ties up cash in receivables.
7. How often should I calculate receivables turnover?
Quarterly or annually is common. Tracking it on a regular schedule shows trends early enough to adjust credit terms or collection steps.
Report an issue with this page
Spotted a wrong result or unclear explanation? Report an issue or read our editorial policy.