

NOPAT Calculator: Net Operating Profit After Tax
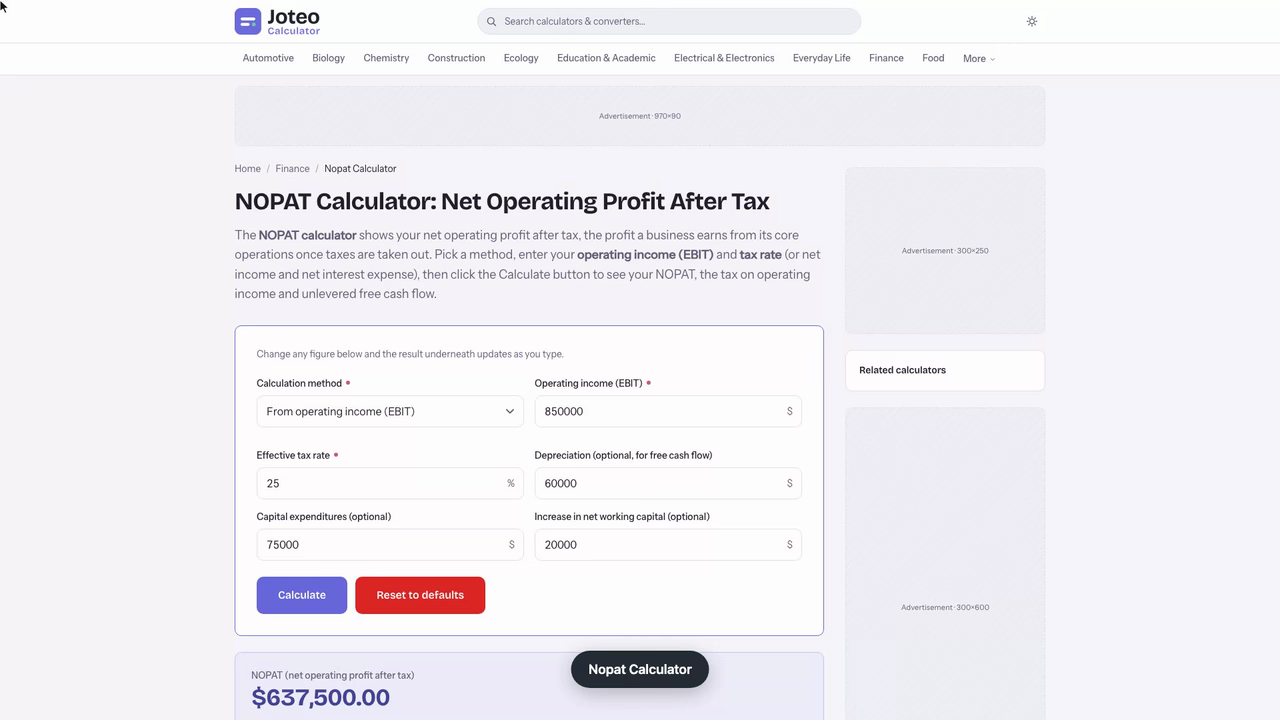
The NOPAT calculator shows your net operating profit after tax, the profit a business earns from its core operations once taxes are taken out. Pick a method, enter your operating income (EBIT) and tax rate (or net income and net interest expense), then click the Calculate button to see your NOPAT, the tax on operating income and unlevered free cash flow. Also try the Apc Calculator.
Nopat Calculator inputs and result
NOPAT (net operating profit after tax)
—
- Operating income used
- —
- Tax on operating income
- —
- Unlevered free cash flow
- —
Table of contents
Who wrote and checked this page


Want to know how much profit a business keeps from its core operations once income tax is taken out? This NOPAT calculator turns operating income and a tax rate into net operating profit after tax, a financial measure that shows operating profitability with no debt costs mixed in. Enter two numbers, read one result, and compare it with any other company in minutes.
What Is NOPAT and Why Does It Matter?
NOPAT stands for net operating profit after tax. It is the profit a company earns from its core operations after taxes, calculated as if the business carried no debt. Because the figure ignores how a company is financed, it is an unleveraged view of operating efficiency, and that is exactly why analysts, investors and creditors lean on it when they compare one company with another.
Net income cannot do that job, because interest on debt shrinks it and gives a tax shield that flatters it. Operating profit after tax strips both effects out. The result is a cleaner read on business performance, a building block for valuation work, and the starting point for business valuation models that ask what the operations alone are worth to shareholders.
Financial analysis built on NOPAT is only as reliable as the EBIT and the tax assumption you enter, so treat the calculator as a fast way to do the arithmetic and your own judgment as the part that matters. Finance teams use it to track core profitability from year to year, to rank business units by the profitability they deliver, and to judge whether a rise in sales (revenue) is turning into real operating gains or just higher expenses.
How to Calculate NOPAT Step by Step
To calculate NOPAT, you only need the income statement and a tax assumption. The step-by-step process is short enough to follow by hand, which is also how you can double check the calculator before trusting any output from it:
- Find operating income (EBIT) on the income statement.
- Choose the tax rate that applies to that operating income.
- Subtract the implied tax and keep what is left as your net operating profit after tax.
Start With EBIT
EBIT means earnings before interest and taxes. It equals gross profits less operating expenses such as wages, rent and marketing. The calculator expects this line, and it should already exclude interest expense and any non-operating income, since a gain on selling a building says nothing about the core operations. Revenue minus every operating cost, including all the expenses of running stores, is where this figure comes from. If a statement shows only net income, add back net interest first, because the calculator cannot guess what was paid to lenders.
Pick the Effective Tax Rate
Use the effective tax rate from the financial statements, which is taxes paid divided by pretax profit, rather than the headline statutory rate. A tax rate near 23.6% reads very differently from a 35% statutory figure, and that gap flows straight into cash. Check the tax note for one-time credits that would distort the rate before you rely on it, then type the rate into the calculator as a percentage.
NOPAT Formula and the Inputs Behind It
The NOPAT formula multiplies operating income by one minus the tax rate:
$$\text{NOPAT} = \text{EBIT} \times (1 - \text{Tax Rate})$$
When the income statement does not break out operating income, a second route works from the bottom line. Add the after-tax cost of interest back to net income:
$$\text{NOPAT} = \text{Net Income} + \text{Net Interest Expense} \times (1 - \text{Tax Rate})$$
Both routes give the same figure, and it is worth running each once as a check. A NOPAT calculation is always a comparison tool: look at the result next to peers in the same industry, because cost structures and efficiency differ widely from one industry to the next, and a figure that looks strong in one sector can be average in another. A good calculator will accept either route, so you can switch between them to test the inputs.
NOPAT Calculator Example With Your Own Figures
Here is a NOPAT example for a regional bakery chain. The calculator needs only two entries for the headline result, and the calculator returns the answer the moment you press the button, and the table shows what a company like this would type in and read back from the calculator. See also our Cash Flow per Share Calculator.
| Item | Amount |
|---|---|
| Operating income (EBIT) | $2,847,300 |
| Tax rate | 23.6% |
| Tax on operating income | $671,962.80 |
| Net operating profit after tax | $2,175,337.20 |
The calculator multiplies $2,847,300 by 0.764 and returns $2,175,337.20. As a cross-check, the same company reports $412,600 of interest expense and net income of $1,860,110.80. Adding the after-tax interest of $315,226.40 to net income lands on the identical figure, so the calculator and the bottom-up route agree.
Now look at sensitivity. Hold EBIT steady and change only the rate, and each point of tax moves the result by about $28,473. At 21% the calculator returns $2,249,367; at 26% it returns $2,107,002. Small tax changes matter less than a change in operating income, yet they never vanish, and the calculator makes that trade-off easy to see. Watch the performance of the margin too: a stronger store mix lifts EBIT far more than a tax tweak does.

Testing a Freight Broker's NOPAT Before Making an Offer
Priya is a corporate development analyst deciding whether a small freight brokerage is worth a bid. Her question is simple: does the target's operating profitability clear her firm's 12% return hurdle on invested capital? She pulls three numbers from the target's financial statements: EBIT of $1,386,450, invested capital of $9,870,000, and a reported tax rate of 14.8%. You might also find our Free Cash Flow Calculator useful.
She enters the EBIT and the 14.8% rate into the NOPAT calculator, and the result reads $1,181,255. Dividing by invested capital gives a return of 11.97%, which already sits just under her 12% hurdle. Before reading that as a near miss, she checks the tax note. The low rate came from a one-time credit; the normal rate for this business is about 26.5%, a federal-plus-state figure she trusts more than a single odd year.
| Tax rate used | NOPAT | Return on invested capital |
|---|---|---|
| 14.8% (reported) | $1,181,255 | 11.97% |
| 26.5% (normalized) | $1,019,041 | 10.32% |
Rerunning the calculator at 26.5% drops net operating profit after tax to $1,019,041, and the return to 10.32%, well below the hurdle. What stands out is that the credit, not the operations, produced the apparent near pass. Solving backward, EBIT would have to reach about $1,611,429 at the normalized rate to earn 12%, roughly $225,000 more than the target reports.
The caveat is that this calculator takes whatever rate you type, so it cannot tell a credit from a durable rate. Priya's next step is concrete: she drafts a lower offer based on the $1,019,041 figure and asks the seller for a three-year tax history before sending it.
After Tax Operating Income Versus Net Income
Another name for the same idea is after tax operating income, and some reports abbreviate it as ATOI. The key contrast is with net income, which includes interest payments and the tax saved on them. Net income answers what shareholders keep after paying lenders; NOPAT answers how well the operations perform before financing. When a company has no debt, net operating profit after tax and net income are the same number.
Use the after-tax operating profit from the calculator when you compare companies with different mixes of borrowing, and use net income when you want the owner's final bottom line. If you are weighing interest cover, net income is the better lens.
Capital Structure and Leverage
A company's capital structure decides how much of its income goes to lenders. Heavy debt lowers net income but leaves NOPAT untouched, which is why leverage cannot hide weak operations behind it. In the bakery example, net income falls from $2,175,337 with no debt to $1,564,137 when interest reaches $800,000, while NOPAT stays at $2,175,337.

Adjustments That Change Your ATOI Figure
Reported numbers are rarely ready to enter as they are, and each adjustment below changes the EBIT your NOPAT starts from. Strip out non-operating income such as investment gains, because it does not belong to the core business. Treat a large legal settlement or a restructuring charge as a one-off, and reverse the tax effect that went with it. Mergers and acquisitions often introduce unusual costs, so an acquisition year deserves a closer look before you compare it with a normal one.
Analysts also sometimes capitalize leases or research costs, and the result is a NOPLAT figure, short for net operating profit less adjusted taxes. Decide your adjustments once, apply them to every company in the comparison, and write them down so the numbers stay comparable. Most online calculators take the adjusted EBIT as a single input, so do the cleanup before you open the calculator rather than after.
Depreciation and One-Time Items
Depreciation is a non-cash expense, so it does reduce EBIT and therefore NOPAT, even though no money leaves the account. That is fine for a profit measure, and it is corrected later when you move to cash. One-time tax savings, such as a credit that will not repeat, should stay out of the rate you type into the calculator.
How Net Operating Profit After Tax Feeds Free Cash Flow
Valuation work rarely stops at the profit line. Net operating profit after tax is the base of the unlevered cash flow that discounted cash models use, and it also drives economic value added. Together they turn an accounting profit into a statement about how much cash and value the operations produce, which is what an acquirer or an investor cares about most. Read the operating profit as the earnings engine and the cash flow as what is left to distribute. A calculator that stops at NOPAT is useful, but the calculator becomes far more valuable when you carry its output into these next steps.
Unlevered Free Cash Flow and FCFF
Take the NOPAT the calculator returned and convert it to cash. Unlevered free cash flow, also called FCFF or free cash flow to the firm, starts with NOPAT, adds back depreciation, then subtracts capital expenditures and any increase in net working capital. For the bakery chain: $2,175,337.20 plus $318,400 of depreciation, less $505,900 of capital expenditures and $96,200 of extra working capital, gives $1,891,637.20.

Economic Value Added and ROIC
Economic value added (EVA) takes the calculator's NOPAT of $2,175,337.20 and subtracts a charge for the cost of capital. With $14,260,000 of invested capital and a 9.1% cost of capital, the charge is $1,297,660, so EVA is $877,677.20. Dividing NOPAT by invested capital gives a return on invested capital (ROIC) of 15.25%, comfortably above the cost of capital. This metric tells you the company is creating value rather than just reporting profit, and it is the clearest reason to run the calculator for several years in a row instead of once.
FAQs around Nopat Calculator
1. What does a NOPAT calculator do?
It turns operating income and a tax rate into net operating profit after tax, the after-tax profit from a company's core operations as if it carried no debt.
2. What is the NOPAT formula?
NOPAT = EBIT x (1 - tax rate). If you only have net income, use NOPAT = net income + net interest expense x (1 - tax rate).
3. Which tax rate should I use?
Use the effective tax rate from the financial statements, taxes paid divided by pretax profit, and normalize it if a one-time credit distorted the year.
4. How is NOPAT different from net income?
Net income includes interest and the tax saved on it. NOPAT removes both, so it measures operations alone. With no debt the two figures match.
5. How does NOPAT relate to free cash flow?
Unlevered free cash flow starts with NOPAT, adds back depreciation, then subtracts capital expenditures and increases in net working capital.
6. Can I compare NOPAT across companies?
Yes, it is designed for that because debt does not distort it, but compare companies in the same industry since cost structures differ.
7. Should I adjust EBIT before using the calculator?
Often yes. Remove non-operating gains and one-time charges so the figure reflects only core operations.
Report an issue with this page
Spotted a wrong result or unclear explanation? Report an issue or read our editorial policy.