

Safety Stock Calculator: Formula, Reorder Point & Z-Score
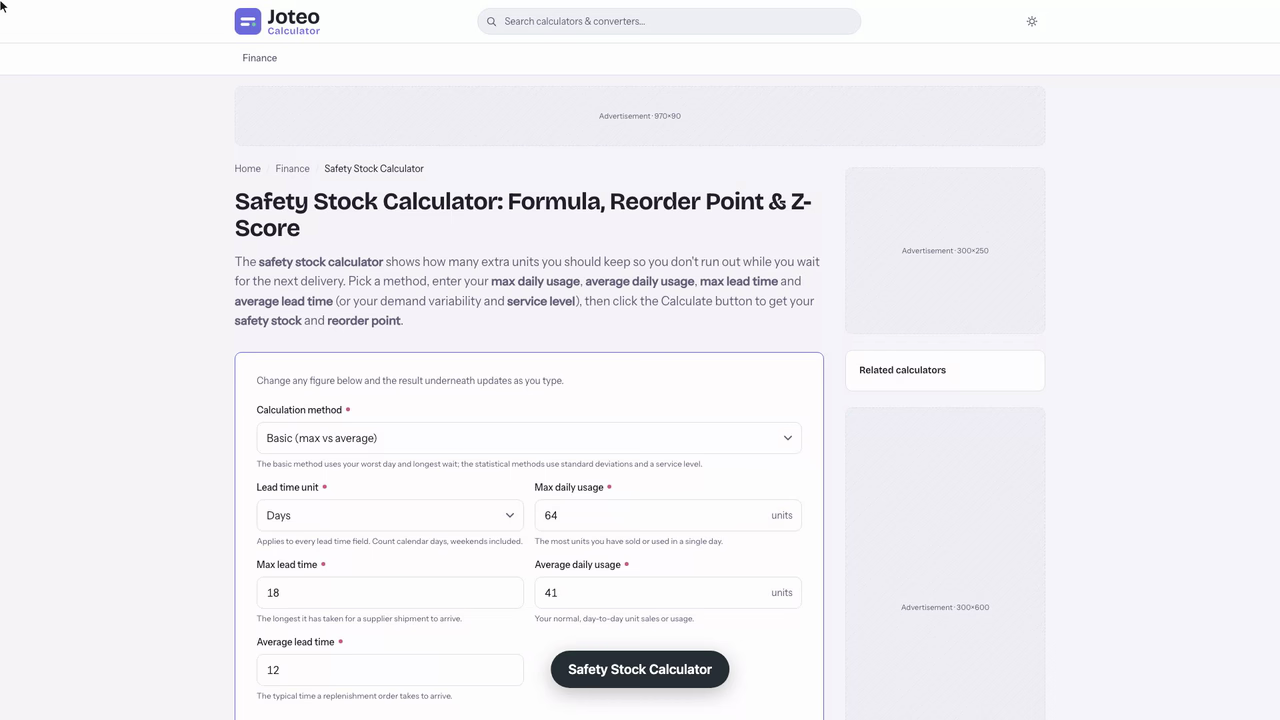
The safety stock calculator shows how many extra units you should keep so you don't run out while you wait for the next delivery. Pick a method, enter your max daily usage, average daily usage, max lead time and average lead time (or your demand variability and service level), then click the Calculate button to get your safety stock and reorder point. Also try the Margin And VAT Calculator.
Safety Stock Calculator inputs and result
Safety stock
—
- Reorder point
- —
- Z-score used
- —
Table of contents
Who wrote and checked this page


Running out of a best-seller costs you twice: the lost sales today and the customer satisfaction you spent months earning. The safety stock calculator tells you how much extra inventory to hold so a sales spike or a late lead time doesn't turn into stockouts, and it gives you the reorder point that keeps that cushion intact.
What Buffer Stock Means for Your Inventory
Safety stock, also called buffer stock, is the quantity you keep on the shelf beyond what you expect to sell while a new order is on its way. In inventory management terms, it is your insurance against the gaps between forecast and actual sales.
Every business with a supply chain needs some. Without it, an out-of-stock item sends shoppers elsewhere, and customer loyalty rarely returns. Back ordering can soften the blow for some buyers, but most will not wait. Too much safety stock inventory becomes excess stock clogging your logistics network, so measure it rather than guess.
Demand Uncertainty and Lead Time Uncertainty
Two sources of risk drive every buffer:
- Demand uncertainty — customer demand swings with peak season, promotions, weather and seasonality. Demand variations are larger for trend items than for staples, and weak forecast accuracy makes them worse.
- Lead time uncertainty — the time from raising a purchase order to having goods on the shelf. Production delays, transit time, customs holds and supplier delays all stretch it.
Both sides of supply and demand move at once in real life, which is why the methods below treat them separately and together. Count lead time in calendar days, weekends included.
How to Use the Safety Stock Calculator
The safety stock calculator above needs four numbers, all taken from your own sales and receiving records:
- Enter your max daily usage: the most units sold or consumed on any single day, in units per day.
- Enter your max lead time: the longest wait, in days, you have had for a replacement shipment.
- Enter your average daily usage: what a typical day looks like.
- Enter your average lead time: how many days a normal order takes to reach your warehouse.
Click Calculate and you get the safety stock in units plus the level at which to reorder, so it works as a combined safety stock & reorder point calculator.
Safety Stock Formula: The Average-Max Method
The standard safety stock formula compares your worst-case demand during the longest wait with your normal demand during a normal wait:
$$\text{Safety Stock} = (\text{Max Daily Usage} \times \text{Max Lead Time}) - (\text{Average Daily Usage} \times \text{Average Lead Time})$$
Some guides write the same thing as maximum daily demand times maximum lead time minus average daily demand times average lead time. The first bracket is the worst-case demand before a delivery lands; the second is what you would use anyway. The gap is the buffer.
The average-max method is the easiest answer to how to calculate safety stock because it needs only historical data you already have. Its weakness is outliers: one freak day or one ship stuck in port inflates the maximums and pushes the buffer up for a year. Cap or remove one-off events before you enter them.
Safety Days: The Rule-of-Thumb Shortcut
The oldest approach skips the formula and holds a fixed number of safety days of average sales. At 41 units a day, four days of cover means 164 units. It is quick, but it ignores how volatile the item really is, so use it only alongside an ABC classification that gives high sales volume items more days than slow movers.
Safety Stock Calculation Example
An online pet store's records for a 12 kg bag of dog food show:
- Max daily usage: 64 bags (a holiday weekend)
- Average daily usage: 41 bags
- Max lead time: 18 days (a delayed truck)
- Average lead time: 12 days
Run the safety stock calculation:
$$\text{Safety Stock} = (64 \times 18) - (41 \times 12) = 1{,}152 - 492 = 660 \text{ bags}$$
The store should hold a safety stock quantity of 660 bags. The reorder point is the average lead-time demand plus that buffer: 492 + 660 = 1,152 bags. Notice that this equals the worst-case figure of 64 × 18. With this method that is always true, so the trigger simply covers the worst day for the longest wait. You can check this in Excel or any spreadsheet with one cell per input.

Finding a Café Group's Safety Stock Quantity for Oat Milk
An operations lead for a four-café group is deciding how many 1-litre oat milk cartons to keep in the shared storeroom before the winter menu launches. The answer: the max-versus-average result says 849 cartons, but once a one-off strike week is removed from the history, the buffer worth holding is 320 cartons, with a reorder trigger of 1,154.
The inputs come from the last 90 days of till exports and supplier delivery notes, entered in this order:
- Busiest day: 187 cartons (a Saturday with a seasonal drink promotion)
- Average daily usage: 132.4 cartons
- Max lead time: 9 days (the week a port strike held a container)
- Average lead time: 6.3 days, counted in calendar days
The tool works through (187 × 9) − (132.4 × 6.3) = 1,683 − 834.12 = 848.88, shown as 849 cartons of safety stock. That is 6.4 days of average sales sitting idle, which is the first warning sign. Changing one input shows why:
| Longest wait entered | Safety stock (cartons) |
|---|---|
| 9 days (strike week kept) | 849 |
| 8 days | 662 |
| 7 days | 475 |
Every extra day in the maximum adds 187 cartons, the full peak-day figure. The number to watch here is the longest-wait input, not peak sales.
As a cross-check, the statistical method uses a daily usage spread of 23.8 cartons and a delivery spread of 1.4 days. At a 95% cycle level, Z = 1.645, the standard normal value for that target, and the result is 1.645 × √(2,939 + 34,358) = 320 cartons. Most of the 37,297 under the root comes from the delivery spread, not from sales. Pushing the target to 99% (Z = 2.326) gives 453 cartons, still about half the max-versus-average answer.
A subtlety worth knowing: the max-versus-average method assumes the busiest sales day and the slowest delivery land in the same cycle. Here the promotion Saturday and the strike week were two months apart, so the 849 figure insures against an event that never happened. Treat it as an upper bound, not a target.
The decision is to set the storeroom alert at 834 + 320 = 1,154 cartons and rerun the numbers after the winter menu's first four weeks, when the promotion's real daily usage is known.
Statistical Safety Stock with Standard Deviation
Statistical safety stock replaces the maximums with how much demand and lead time actually vary. It assumes a normal distribution, where values far from the average have a low probability. You need the standard deviation of daily demand (σd) from your sales data (Excel's STDEV.S function on a column of daily sales does it) and, for the full version, the standard deviation of lead time (σLT):
$$SS = Z \times \sqrt{(LT \times \sigma_d^2) + (D^2 \times \sigma_{LT}^2)}$$
Here LT is average lead time, D is average daily usage, and the square root combines both risks.
Choosing a Service Level and Z-Score
Z is the service factor, also called the service coefficient: how many standard deviations of cover you want. It comes from your target service level, the share of replenishment cycles that should finish without a stockout. That is the cycle service rate, which is not the same as the percentage of orders filled.
| Service target | Z | Dog food buffer (bags) |
|---|---|---|
| 90% | 1.28 | 137 |
| 95% | 1.65 | 176 |
| 97.5% | 1.96 | 210 |
| 99% | 2.33 | 249 |
Each step toward a 100% service rate costs more stock than the last, and 100% itself would need infinite inventory.
Demand Variability, Lead Time Variability, or Both
For the dog food, σd = 9 bags and σLT = 2.5 days, at Z = 1.645 (95%):
- Sales swings only: 1.645 × 9 × √12 = 51 bags. Use this when deliveries arrive like clockwork.
- Lead time only: 1.645 × 41 × 2.5 = 169 bags.
- Both, independent: 1.645 × √(972 + 10,506) = 176 bags. The usual choice when you track both.
- Both, dependent: 51 + 169 = 220 bags, for cases where a sales surge also slows your supplier.
Here lead time variability dominates: the 10,506 term dwarfs the 972 term. Steadier supply, through better supplier reliability, would cut this buffer far more than better forecasting would.

Reorder Point and Economic Order Quantity for Your Safety Stock Level
Safety stock and the order trigger work as a pair. The formula is: See also our Hhi Calculator.
$$\text{Reorder Point} = (\text{Average Daily Demand} \times \text{Average Lead Time}) + \text{Safety Stock}$$
With the statistical buffer, the dog food trigger is 492 + 176 = 668 bags. When stock falls to that line, you order; if the delivery is on time, the shelf bottoms out near your safety stock level just as replenishment arrives.
How much to order is a separate question. The economic order quantity balances ordering costs against storage to set the order size, while safety stock only sets the floor. Set low stock alerts in your inventory management system at that level so day-to-day operations trigger orders without anyone checking a report. Inventory levels then cycle between that floor and the floor plus one order.
Choosing Between Safety Stock Formulas
When you are calculating safety stock for the first time, the choice between safety stock formulas comes down to the data you trust:
- Little or patchy history in your business: start with the max-minus-average approach. It is conservative and easy to explain.
- A year or more of daily sales: use the statistical formula with demand variability only.
- Reliable receiving dates as well: add lead time to the formula.

In inventory management, data quality matters more than the method. Run both, treat the answers as a range, and check them against your actual fill rate. If you use forecast demand rather than past sales, measure σd as forecast error, not raw sales swings.
Limits of the Normal Distribution
Real sales are rarely symmetrical: a few very high days skew them right, and suppliers are often late but seldom early. The bell curve misses those extremes and ignores seasonality, so the statistical buffer comes out too low for lumpy items. For those, use a higher Z, the max-versus-average result, or a Poisson or gamma fit, and let real shortages be the final check.
Costs of Carrying Too Much Safety Stock Inventory
Every unit of buffer has carrying costs: storage, insurance, shrinkage and the cash locked on the shelf. High holding costs and inventory costs are why the aim is balance, not maximum cover. Oversized safety stock levels often hide deeper supply chain problems such as poor data or unreliable vendors, and they slow inventory velocity and turnover. For a small business, that cash matters.
Review your figures at least once a season, or whenever lead times or sales patterns shift. Compare the new buffer with current stock levels and trim any overstock as you sell it down. Your ending inventory at each count will show whether the new figures hold.
FAQs around Safety Stock Calculator
1. What is safety stock?
Safety stock is extra inventory you hold on top of expected sales to cover demand spikes and late deliveries. You only dip into it when demand runs above average or a shipment takes longer than usual, so it protects you from stockouts and lost sales.
2. What is the difference between safety stock and buffer stock?
Many businesses use the two terms for the same thing. Where they are separated, buffer stock usually means inventory held against swings in customer demand, while safety stock also covers supplier delays and other supply problems.
3. How do you calculate safety stock with the basic formula?
Multiply your max daily usage by your max lead time, then subtract your average daily usage multiplied by your average lead time. The difference is the number of units to keep in reserve.
4. When should I use the statistical safety stock method?
Use it when you have enough daily sales history to measure the standard deviation of demand, and ideally of lead time too. It ties the buffer to a target service level and usually gives a lower, more precise figure than the max-vs-average method.
5. How is the reorder point related to safety stock?
The reorder point is the stock level that should trigger a new order. It equals average daily usage multiplied by average lead time, plus your safety stock.
6. Should lead time include weekends?
Yes. Count lead time in calendar days, because carriers, ports and customs keep working through the weekend even when your office is closed.
7. How often should I recalculate safety stock?
Review it at least once a season, and again whenever supplier reliability or customer demand changes noticeably, such as before a peak season or after switching suppliers.
Report an issue with this page
Spotted a wrong result or unclear explanation? Report an issue or read our editorial policy.