

HHI Calculator: Herfindahl-Hirschman Index for Market Share
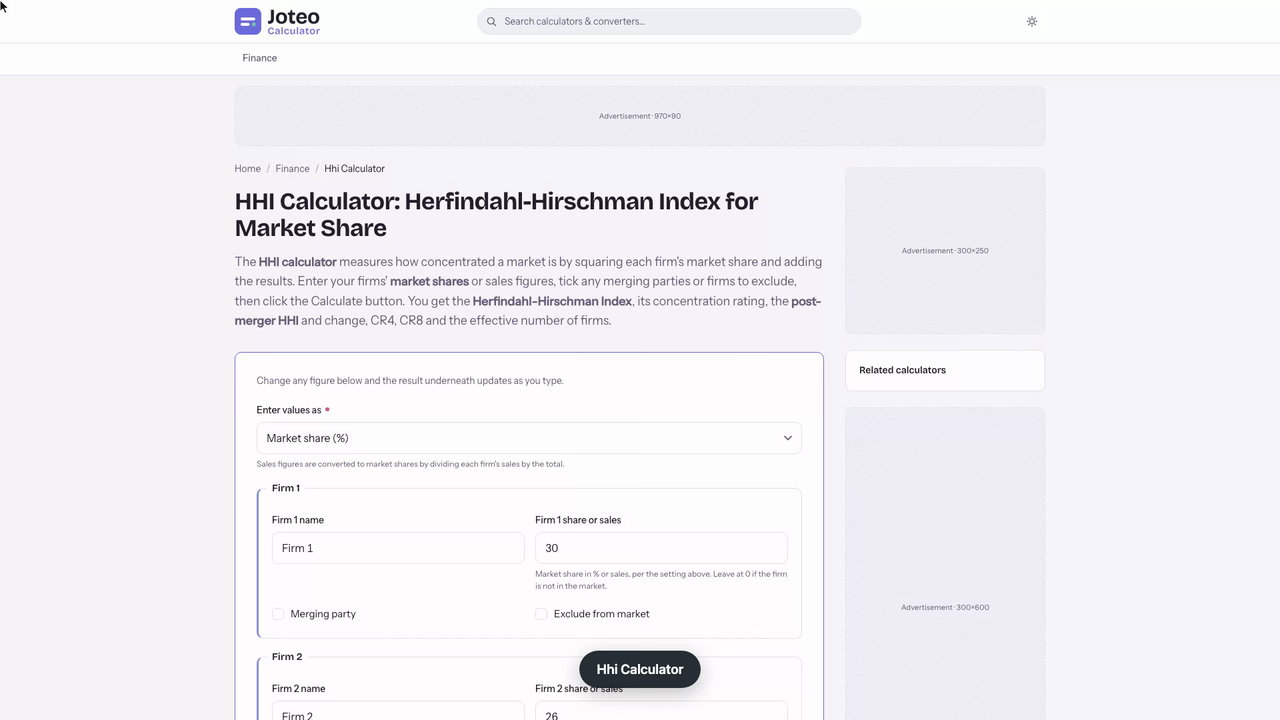
The HHI calculator measures how concentrated a market is by squaring each firm's market share and adding the results. Enter your firms' market shares or sales figures, tick any merging parties or firms to exclude, then click the Calculate button. You get the Herfindahl-Hirschman Index, its concentration rating, the post-merger HHI and change, CR4, CR8 and the effective number of firms. Also try the Safety Stock Calculator.
Hhi Calculator inputs and result
Herfindahl-Hirschman Index (HHI)
—
- Concentration (2023 DOJ/FTC guidelines)
- —
- Concentration (1,500 / 2,500 scale)
- —
- Total market share
- Post-merger HHI
- —
- Change in HHI
- —
- Merged firm share
- CR4 (top 4 firms)
- —
- CR8 (top 8 firms)
- —
- Effective number of firms
- —
- Firms in the market
- —
Results Table
Table of contents
Who wrote and checked this page


Enter each competitor's share into this HHI calculator and you get the Herfindahl index for that market in seconds: one number, sometimes called the HHI-score, that sums up market concentration and market competitiveness. Squaring the market shares of all firms lets the biggest players drive the result, so you can see at once whether a market is unconcentrated, moderate or highly concentrated, and how a deal would shift it.
What the HHI Calculator Measures
The Herfindahl-Hirschman Index (HHI) is an economic concept that measures how evenly sales are spread across the enterprises in one industry. It carries the names of two economists: Albert Hirschman proposed it in 1945 and Orris Herfindahl popularised it in 1950. It sits at the centre of competition law and antitrust enforcement because it turns a list of shares into one reading of market structure. A low HHI index signals many small sellers; a high one, a few firms holding most of the business.
The HHI Formula
The HHI formula squares every seller's percentage share and adds the results:
$$HHI = s_1^{2} + s_2^{2} + s_3^{2} + \dots + s_n^{2}$$Here \(s_i\) is the market share of firm \(i\), entered as a whole number (30 for 30%), and \(n\) is the number of firms. The scale runs from near 0 to 10,000 for a single seller. Some sources divide by 10,000 and quote a decimal, so 2,500 points becomes 0.25.
Why Squared Market Shares Favor Large Firms
Squaring is what makes the index sensitive to inequality. One dominant leader with a tail of small rivals scores far higher than similarly-sized sellers with the same combined share, because each share is weighted by its own size.

How to Calculate HHI: A Six-Firm Example
Take a regional market with six competitors, shares taken from annual sales figures. Square each share and add the column:
| Seller | Market share (%) | Squared share |
|---|---|---|
| Firm A | 30 | 900 |
| Firm B | 26 | 676 |
| Firm C | 16 | 256 |
| Firm D | 12 | 144 |
| Firm E | 10 | 100 |
| Firm F | 6 | 36 |
| Total | 100 | 2,112 |
This HHI calculation gives an HHI statistic of 2,112. A Herfindahl-Hirschman Index calculator needs one input per seller, its market share; lumping small sellers into an "Other" row overstates the result, so list each one and check the total is 100%.
Reading HHI Ranges and Market Concentration
The higher the score, the closer the market is to a full monopoly; a pure monopoly scores the maximum and a reading near zero means perfect competition. Current U.S. bands:
- Below 1,000: unconcentrated, usually a highly competitive industry
- 1,000 to 1,800: moderately concentrated
- Above 1,800: highly concentrated
Merger Guidelines and the Structural Presumption
The Department of Justice and the Federal Trade Commission set these HHI thresholds in the 2023 Horizontal Merger Guidelines, lowering the old 1,500 and 2,500 cut-offs. A deal triggers a structural presumption of competitive harm when the result tops 1,800 and the change exceeds 100. These are screening thresholds, not automatic bans.

Post-Merger HHI and the Change in HHI
Regulators focus on the jump a proposed merger would cause. If sellers C and D in the example (16% and 12%) combine, the merged firm holds 28% and the post-merger HHI rises to 2,496. The change equals twice the product of the merging firms' shares: \(2 \times 16 \times 12 = 384\) points. That clears both 2023 tests, though the merged firm stays under the separate 30% share test.

Antitrust laws elsewhere work similarly: the European Commission also reviews the change in mergers and acquisitions. Market definition, meaning which sellers count as rivals, decides whose shares you enter, so a wider or narrower market moves both the score and its change; it is where most antitrust concerns are argued.
An HHI Calculation for a Ready-Mix Concrete Acquisition
A client wants to know, before filing, whether buying a smaller rival in one metro's ready-mix concrete market will draw a presumption under the 2023 guidelines. The short answer: yes, the score rises from 2,168 to 2,391, a jump of 223, well past both lines.
I start from 2025 revenue for the seven plants that deliver in the county, in millions: 41.7, 33.2, 19.8, 14.6, 9.3, 6.1 and 3.9, a total of $128.6M. The tool wants shares, so I divide each by the total first: the buyer's 19.8 becomes 15.40% and the target's 9.3 becomes 7.23%. I enter all seven to two decimals, then run it again with the buyer and target combined at 22.63%.
As a cross-check I compute the change directly: \(2 \times 15.40 \times 7.23 = 222.7\), which matches the gap between the two runs. The combined share stays under 30%, so only the concentration test applies, but that one is enough.
| Scenario | Before | After | Change |
|---|---|---|---|
| County market, 7 plants | 2,168 | 2,391 | 223 |
| Adding a $38.4M plant across the county line | 1,814 | 1,946 | 132 |
The client's best argument is a wider market definition, so I rerun with the out-of-county plant added. It helps less than hoped: the pre-deal score drops to 1,814, still just above 1,800, and the change is 132, still above 100. The number to watch here is the change, not the level, because the level only falls below 1,800 if the market grows even wider.
One trap I nearly fell into: rounding the seven shares to whole numbers makes them sum to 99% and gives 2,129, about 39 too low. Always enter unrounded shares, or the sales themselves converted at full precision.
The figure also shows the next step. Keeping the change at or below 100 requires the target's retained share to stay under \(100 \div (2 \times 15.40) = 3.25\%\), about $4.2M of its $9.3M. So I draft a remedy model in which the buyer divests roughly $5.1M of the target's delivery contracts to an outside entrant, and rerun the concentration index on that structure before the client commits.
Herfindahl-Hirschman Index vs. Concentration Ratio
A concentration ratio simply adds the shares of the largest sellers: CR8 for the top eight, CR4 for the top four. It ignores how share is split among the leaders, so two markets with the same top-four total can give very different HHI readings.
CR4 and the Effective Number of Firms
In the example, the top four sellers hold 84% before the deal and 94% after. The effective number of firms, \(10{,}000 \div HHI\), converts the score into a count of equal-sized firms that would give the same reading: 4.73 before, 4.01 after.
Where the Herfindahl Index Falls Short
The index is a screening tool, not a verdict. It sees only shares, not barriers to entry, demand elasticity or how hard rivals fight, so a concentrated market can still have low prices if entry is easy. High scores hint at pricing power and market power without proving either.
How Investors Read HHI
For investors, a high HHI can mean margin stability and calmer competitive dynamics, but also regulatory risk for any buyer of a rival. A low reading suggests a fragmented field ripe for consolidation.
FAQs around Hhi Calculator
1. What does the HHI measure?
The Herfindahl-Hirschman Index measures market concentration: how much of a market's sales sit with its largest firms. It is the sum of every firm's squared percentage market share, so it runs from near 0 for a market of many tiny firms to 10,000 for a single firm with 100%.
2. How do I calculate HHI by hand?
Square each firm's market share written as a whole number (25% becomes 25, squared 625) and add the squares. If you only have sales, divide each firm's sales by the market total first to get its share.
3. What HHI counts as highly concentrated?
Under the 2023 DOJ/FTC Merger Guidelines, a market above 1,800 is highly concentrated, 1,000 to 1,800 is moderately concentrated and below 1,000 is unconcentrated. Older guidance and many textbooks use 1,500 and 2,500 as the cut-offs instead, which is why the calculator shows both ratings.
4. How does a merger change the HHI?
When two firms with shares a and b combine, the index rises by exactly 2 x a x b. The 2023 guidelines presume a merger may harm competition when the post-merger HHI is above 1,800 and the change is more than 100, or when the merged firm's share is above 30% and the change is more than 100.
5. Why are market shares squared?
Squaring gives large firms more weight than small ones, so a market led by one dominant firm scores higher than a market of similar-sized rivals with the same combined top-firm share.
6. What is the difference between HHI and CR4?
CR4 adds the shares of the four largest firms and ignores how those shares are split. The HHI uses every firm and is sensitive to inequality, so two markets with the same CR4 can have very different HHI values.
7. What is the effective number of firms?
It is 10,000 divided by the HHI: the number of equal-sized firms that would produce the same index. An HHI of 2,000, for example, behaves like a market of five equal firms.
8. Does a high HHI always mean high prices?
No. The HHI describes market structure only. Low barriers to entry, price-sensitive customers or aggressive rivalry can keep a concentrated market competitive, so treat the index as a screening tool rather than a verdict.
Report an issue with this page
Spotted a wrong result or unclear explanation? Report an issue or read our editorial policy.