

ROS Calculator: Find Your Return on Sales Percentage
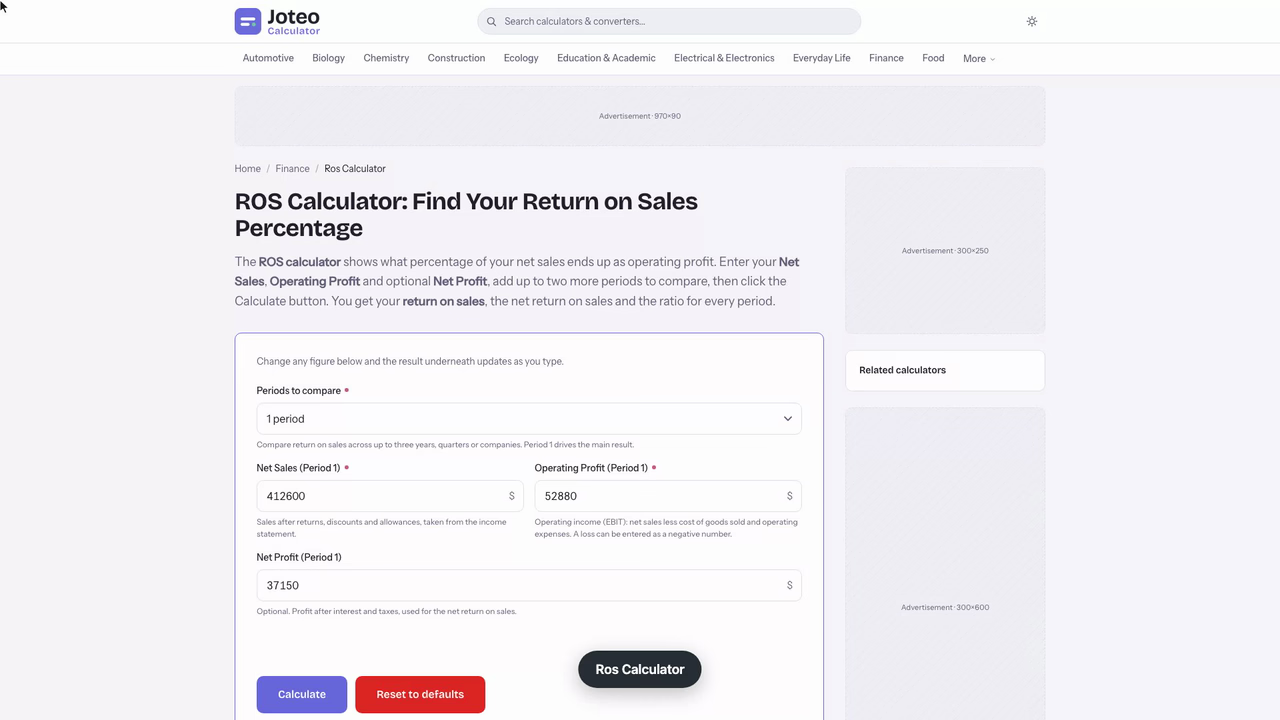
The ROS calculator shows what percentage of your net sales ends up as operating profit. Enter your Net Sales, Operating Profit and optional Net Profit, add up to two more periods to compare, then click the Calculate button. You get your return on sales, the net return on sales and the ratio for every period. Also try the Financial Leverage Ratio Calculator.
Ros Calculator inputs and result
Return on Sales (ROS)
—
- Net Return on Sales (Period 1)
- —
- Return on Sales (Period 2)
- —
- Net Return on Sales (Period 2)
- —
- Return on Sales (Period 3)
- —
- Net Return on Sales (Period 3)
- —
Table of contents
Who wrote and checked this page


The ROS calculator turns two lines from your income statement into one return on sales percentage. Enter your operating profit and net sales, and the return on sales calculator shows how many cents of every dollar come through as profit. Use it to calculate ROS for any month, year or business, then compare that revenue efficiency against peers.
How the ROS Calculator Works
The return on sales (ros) calculator asks for two inputs, operating profit and net sales, both in the same currency and covering the same period. It divides the first by the second and multiplies by 100, so you get a ratio expressed as a percentage rather than a dollar figure. That makes it a simple financial metric for any business, whatever its size. See also our Free Cash Flow Calculator.
- Type in the operating profit for the period you are checking.
- Add the matching total after refunds have been taken out.
- Press calculate and read the result, then change one input to test a what-if.
What Is the Return on Sales Ratio?
The return on sales ratio is an efficiency ratio that shows how much of each dollar of sales survives as operating profit once production and running bills are paid. Some analysts call it the profit to sales ratio. It is a quick read on operating efficiency and overall profitability, and a company can follow its trend over time to judge financial health. Investors watch it as a sign of operational efficiency. A positive result means the company earns an operating profit on its revenue; a negative one means operating costs are larger than sales, and the business is losing money before interest and tax. Higher profitability at the same sales volume usually points to tighter cost control or stronger pricing.
Return on Sales Formula: Dividing Profit by Net Sales
The return on sales formula divides operating income by what the company sold, then scales the answer to a percentage. Operating income is EBIT, the amount left on the income statement after all operating costs. The same approach works on any company's financial statements, from a start-up to a listed group.
$$\text{ROS} = \frac{\text{Operating profit}}{\text{Net sales}} \times 100$$
Net Revenue Inputs
Net revenue is the headline sales total less refunds, price cuts and allowances. Use that adjusted line, because a figure taken before those deductions overstates revenue and inflates your income, and with it your ROS.
How to Calculate Return on Sales Step by Step
To calculate return on sales, take a company that imports loose-leaf tea. It books $438,900 of gross sales in the year. After $26,300 of returns and discounts, the adjusted total is $412,600. Cost of goods sold (COGS) is $241,700, which leaves a gross profit of $170,900. Operating expenses, including SG&A, come to $118,020. Interest, taxes and other non-operating items sit below that line, so net income is not used.
| Line item | Amount |
|---|---|
| Gross sales | $438,900 |
| Returns and discounts | -$26,300 |
| Net sales (revenue) | $412,600 |
| Cost of goods sold | -$241,700 |
| Gross profit | $170,900 |
| Operating expenses | -$118,020 |
| Operating income (EBIT) | $52,880 |
Then ROS = 52,880 ÷ 412,600 × 100 = 12.8%, so about 12.8 cents of operating profit remain from every dollar sold.

Return on Sales Calculator Results: How to Read Them
A 12.8% result means the importer keeps roughly 13 cents of profit per dollar sold. Run the return on sales calculator again for last year and see whether the number is rising or falling; a drop warns that costs are growing faster than revenue. Setting it beside a competitor's performance shows who turns sales into earnings more efficiently, and whether a profitable business can afford dividends or new debt.
Next, stress the inputs. If the importer's operating expenses rise 5% to $123,921 while net sales stay flat, operating profit drops to $46,979 and ROS slips to 11.4%. That 1.4-point fall shows how much room a small cost increase takes from profitability, and it is the quickest check on whether the margin has a cushion.

Operating Margin vs Gross Margin
Operating margin is another name for ROS, so the two always match. Gross margin stops after the direct cost of the tea, which is why the importer's figure is 41.4% while its ROS is 12.8%. Net profit margin goes further and subtracts interest and taxes. Each profit margin answers a different question, so state which one you quote.
A Bike Shop Owner Runs the Return on Sales (ROS) Calculator Before a Rent Rise
My landlord just announced a $450 monthly rent increase, and I need to know whether my bike shop can absorb it. I enter last year's figures: net sales of $184,730 after refunds, $79,415 of parts and bike costs, and $88,962 of wages, rent and utilities. Operating profit comes to $16,353, so the return on sales is 8.9%. That sits in the 5-10% band I consider acceptable for a thin-margin retail business, though not comfortable.
Now the sensitivity run. The rent rise adds $5,400 a year to operating expenses, dropping operating profit to $10,953 and ROS to 5.9%, close to the 5% line where I would start reviewing every cost. The number to watch is gross margin, which is 57.0%: each extra sales dollar leaves about 57 cents to cover overhead.
| Scenario | Net sales | Operating profit | ROS |
|---|---|---|---|
| Last year | $184,730 | $16,353 | 8.9% |
| Rent rise, same sales | $184,730 | $10,953 | 5.9% |
| Rent rise, profit restored | $194,202 | $16,353 | 8.4% |
| Rent rise, ROS restored | $195,943 | $17,346 | 8.9% |
Here is the caveat a quick search will not tell you. Earning back the same $16,353 needs $9,472 more in sales, yet the ratio still lands at 8.4%, because the extra revenue itself has to be earned at a 57% margin. Matching the 8.9% ratio takes $195,943, about $934 more per month, so that is my target, and I will recheck it each quarter against the actual books. The calculator's answer is only as good as the input: if I had used sales before refunds, I would have flattered the result.
Calculate ROS and Judge a Good Return on Sales
Across industries, a good return on sales usually falls between 10% and 20%, while 5-10% can be acceptable in thin-margin trades and under 5% may signal operating problems. Benchmarks differ by trade, so compare against the industry average rather than one universal number.
- Above 20%: strong
- 10-20%: healthy
- 5-10%: acceptable
- Below 5%: review costs

Comparing Against Industry Peers
Pull the filings of industry peers of a similar size and business model, and confirm they define operating profit the same way you do.
Operating Profit Margin Beside Return on Equity and Return on Assets
The operating profit margin measures sales efficiency, while return on equity and return on assets show what owners' money and company assets earn. Return on investment compares one gain with its cost. DuPont analysis ties these together, and capital structure explains why return on equity can move when ROS stays flat. An EBITDA margin simply adds back non-cash charges first. You might also find our Cash Flow per Share Calculator useful.
Limitations of the ROS Formula and Ways to Improve It
This measure includes non-cash charges such as depreciation and amortization, and it rests on accrual accounting, so it never shows whether working capital is stuck in unpaid invoices. To lift the result:
- Raise prices or reduce markdowns
- Trim overhead that does not support sales
- Renegotiate supplier costs
EBIT, EBITDA and Cash Flow
Because the ratio is built on EBIT, it is not cash. Adding depreciation back gives EBITDA, yet even that skips taxes and capital spending, so check cash flow beside your ROS result.
One more caution: a one-off gain, such as selling a warehouse, is not part of normal revenue. Such a gain would inflate the operating profit you enter, so leave it out, or the company's profitability will look better than its everyday trading justifies.
FAQs around Ros Calculator
1. What does the ROS calculator measure?
It shows the share of your net sales that remains as operating profit, expressed as a percentage. A result of 10% means you keep 10 cents of operating profit from every dollar of net sales.
2. What is the return on sales formula?
Divide operating profit by net sales and multiply by 100. Operating profit is revenue less cost of goods sold and operating expenses, which is the EBIT line on the income statement.
3. Is return on sales the same as operating margin?
Yes. Return on sales is another name for operating margin, because both divide operating profit by net sales. Gross margin and net profit margin use different profit figures, so they give different results.
4. What is a good return on sales?
Many analysts treat 10-20% as healthy and 5-10% as acceptable, with anything under 5% worth reviewing. Industries differ widely, so compare against peers in your own sector.
5. Which sales figure should I enter?
Use net sales: gross sales minus returns, discounts and allowances. Entering the figure before those deductions overstates the base and makes the ratio look weaker than it is.
6. Can return on sales be negative?
Yes. If operating expenses and cost of goods sold exceed net sales, operating profit is negative and so is the ratio, which signals the business is losing money from its core operations.
7. What does net return on sales show?
It divides net profit, after interest and taxes, by net sales. Comparing it with the operating figure shows how much financing costs and taxes take from the profit your operations produce.
8. Why compare more than one period?
A single ratio is a snapshot. Comparing two or three periods shows whether profitability is improving or eroding, and separates a one-off bad year from a trend.
Report an issue with this page
Spotted a wrong result or unclear explanation? Report an issue or read our editorial policy.