

Customer Retention Rate Calculator: Formula & Benchmarks
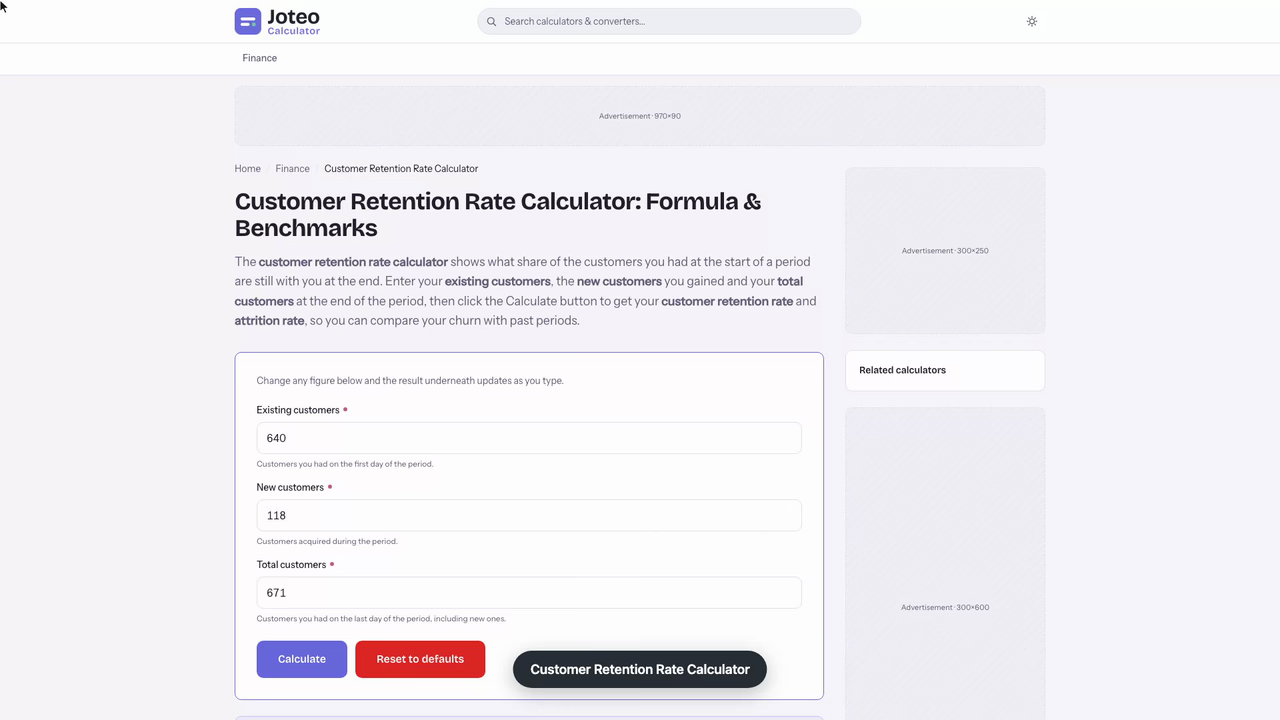
The customer retention rate calculator shows what share of the customers you had at the start of a period are still with you at the end. Enter your existing customers, the new customers you gained and your total customers at the end of the period, then click the Calculate button to get your customer retention rate and attrition rate, so you can compare your churn with past periods. Also try the Cltv Calculator.
Customer Retention Rate Calculator inputs and result
Customer retention rate
—
- Attrition rate
- —
Table of contents
Who wrote and checked this page


Winning new sign-ups feels like progress, but your customer retention rate calculator shows whether the people you already had are sticking around long enough for your business to grow. Enter three counts and you get the percentage of customers you kept over the period, plus the matching share you lost, so you can see at a glance whether your retention rate supports steady profitability or quietly drains it.
How the Customer Retention Rate Calculator Works
The tool answers one question: of the accounts you had on day one, how many were still with you on the last day? It ignores anyone who joined during the window, because a fresh sign-up says nothing about your ability to keep people. That is why this free retention rate calculator asks for three numbers rather than two, and why the result — often abbreviated CRR — can never be pushed up simply by spending more on marketing.
You pick the time period first. Most teams measure monthly, quarterly or annually, and the choice matters: a shorter window almost always produces a higher figure, so only compare results that cover the same length of time.
Existing Customers, New Customers and Total Customers
- Existing customers — the count on the first day, also called beginning customers or the number at the start of the period.
- New customers — every account that signed up inside the window. Some reports label this field new customers acquired.
- Total customers — the headcount at the end of the period, sometimes shown as ending customers. It includes both survivors and newcomers.
Subtract the newcomers from the ending figure and what remains are the accounts you kept. Divide that by the starting count and you have the result.
What the Attrition Rate Output Tells You
Alongside the main figure, the calculator reports the attrition rate, which is simply 100% minus your retention. If 86% of accounts stayed, 14% left. Seeing both side by side stops you from celebrating a number that sounds high while one in seven clients walked out the door.
The Retention Rate Formula, Step by Step
The standard customer retention rate formula strips out new sign-ups, divides the survivors by the opening base, and converts the ratio to a percentage: See also our Grp Calculator.
$$R = \frac{E - N}{S} \times 100$$
Here \(E\) is the count at the end, \(N\) is the number of new sign-ups during the window, and \(S\) is the count at the start. The numerator \(E - N\) is the group of renewing customers; the division tells you what share of the original base they represent. You multiply by 100 only to express the answer as a percentage instead of a decimal.

- Choose a specific period and write down the opening count \(S\).
- Count every account that joined during that given period — this is \(N\).
- Record the closing count \(E\).
- Subtract \(N\) from \(E\), divide by \(S\), then multiply by 100.
Worked Example: One Quarter at a Help-Desk Software Vendor
Picture a small help-desk software company that sells on a subscription plan. It opens the quarter with 640 paying accounts, signs 118 new ones during the quarter, and closes with 671.
- Retained accounts: 671 − 118 = 553
- Retention: 553 ÷ 640 = 0.8641, or 86.4%
- Attrition: 100% − 86.4% = 13.6%, which is 87 accounts lost
The headline gain looks healthy — the base rose by 31 accounts — yet 87 existing clients cancelled. Without the formula, that loss hides behind the sales team's wins.

Chaining Quarters Into an Annual Customer Retention Rate
Here is how the same vendor looks across a full year, with each quarter's closing count carried forward as the next quarter's opening count:
| Quarter | Start (S) | New (N) | End (E) | Retained | Retention rate | Churn rate |
|---|---|---|---|---|---|---|
| Q1 | 640 | 118 | 671 | 553 | 86.4% | 13.6% |
| Q2 | 671 | 104 | 702 | 598 | 89.1% | 10.9% |
| Q3 | 702 | 96 | 731 | 635 | 90.5% | 9.5% |
| Q4 | 731 | 88 | 757 | 669 | 91.5% | 8.5% |

Multiplying the four ratios together gives about 63.7% for the year. Plug the annual totals straight into the formula instead — 757 at the end, 406 new across the year, 640 at the start — and you get (757 − 406) ÷ 640 = 54.8%. The gap exists because the single annual calculation counts every newcomer who joined and then left inside the same year as a loss from the opening base. Neither figure is wrong; they answer slightly different questions, so state which method you used whenever you report the number.

How Retained Customers Relate to Churn and Attrition
Retention and churn are two views of the same event, and the rate of retained customers is the cleanest single measure of customer loyalty you can pull from a billing export. One counts who stayed, the other counts who left, and together they always sum to 100% of the starting base. Understanding that inverse link helps you move between the metrics your finance, product and support teams each prefer.
Retention Rate vs. Churn Rate
The churn rate equals lost customers divided by the opening count. In the Q1 example, 87 ÷ 640 = 13.6%, exactly the complement of 86.4%. Churn is often the more motivating number for a team because it names the problem directly, while retention reads better in board decks. Both come from the same three inputs, so the calculator gives you either one without extra work.
A subtle point: churned customers in logo counts are not the same as revenue churn. Losing ten small accounts and losing one enterprise account can produce very different effects on monthly recurring revenue, even though the logo-based figure treats every account equally.
Voluntary and Involuntary Churn
Some departures are decisions: a client picks a cheaper rival or no longer needs the product. Others are accidents. Involuntary churn comes from failed payments, expired cards and billing errors, and in recurring-billing businesses it can make up a meaningful slice of total losses. Both kinds sit inside the attrition figure the calculator reports, so splitting your cancellations by reason shows how much of the gap to your target a billing fix alone could recover, and whether to fix the offer or fix the billing process.
Testing an Investor Milestone Against Renewing Customers
It is the first week of October, and the finance lead at a payroll-software reseller is preparing the quarterly pack for an investor whose term sheet sets 90% quarterly logo retention as the milestone that unlocks the next funding tranche. The billing system export for 1 July to 30 September is open in one tab, the calculator in another.
The export gives three clean figures. The account list on 1 July shows 1,283 active paying accounts. The sign-up log shows 214 accounts created during the quarter, after removing eleven internal test accounts that sales had set up for demos. The closing list on 30 September shows 1,329.
Those go in as existing, new and total. The calculator subtracts 214 from 1,329, leaving 1,115 accounts that were there on day one and still paying on day ninety-two, then divides by 1,283. The customer retention rate comes back at 86.9%, with attrition at 13.1% — 168 accounts gone, and 3.1 points short of the milestone.
Before writing that number into the pack, the finance lead filters the 168 cancellations by reason code:
- 52 were closed automatically after three failed card charges
- 71 chose to cancel through the account settings page
- 45 were merged into parent accounts after acquisitions
The 52 failed-payment closures matter most. Had those payments been recovered, retained accounts would have been 1,167, and a rerun with 1,381 as the ending count gives 91.0% — above the 90% line. The retention figure says the gap is a billing problem more than a product problem.
The pack goes out with the honest 86.9%, plus a plan: switch on smart card retries and a pre-expiry email for the fourth quarter, and hold the proposed 15% loyalty discount until the next quarterly figure shows whether recovered payments alone close the 3.1-point gap.
What Is a Good Customer Retention Rate?
There is no universal pass mark. A good customer retention rate depends on your industry, contract length, price point and how often buyers need what you sell. The most reliable comparison is against competitors with a similar audience and model, plus your own history — a steady upward trend says more than any single benchmark.
| Quarterly retention | What it usually signals | Where to look first |
|---|---|---|
| Below 70% | Serious fit or value problem | Setup, promised vs. delivered value |
| 70%–80% | Leaky base, growth depends on acquisition | Early-life cancellations, support gaps |
| 80%–90% | Workable, typical of many SMB-focused tools | Pricing tiers, involuntary losses |
| 90%–95% | Strong, compounding base | Expansion revenue, referrals |
| Above 95% | Excellent, common with long contracts | Protect it; watch renewal dates |
These bands are rules of thumb for interpreting your own trend rather than published industry benchmarks; the right target for you is the one your sector peers actually achieve.
SaaS and B2B Benchmarks
For a B2B software company selling annual or multi-year contracts, anything much below the high 80s per year usually points to a product market fit issue. Integrations, shared data and training create real switching costs, so these buyers tend to stay once they are embedded. SaaS products sold month to month to small firms churn faster, because leaving takes a single click.
B2C Retail, Hospitality and Services
A B2C business that relies on repeat visits faces a different reality. Shoppers compare prices constantly and have little to lose by switching, so a result from this calculator that would alarm an enterprise software firm — say, a reading in the 60s or low 70s from the band table above — can be perfectly respectable for a retailer, a restaurant group or a consumer app. Here, brand loyalty and convenience do the work that contracts do for software vendors.
Customer Retention Metrics to Track Alongside It
Retention tells you how many clients stayed. It does not tell you how valuable they are, how happy they are, or how likely they are to leave next. Pair it with a few related metrics so each KPI covers a blind spot of the others.
Why Keeping Customers Beats Customer Acquisition
Every business has two ways to grow its base: win new customers or keep the ones it already has. Customer acquisition pays for ads, sales calls and free trials before a single invoice clears, while keeping an existing account mostly costs good service. When your customer retention rate slips, you have to replace every lost account just to stand still, so acquisition spend climbs while the base stays flat. That is why the customer retention rate is one of the first metrics investors and lenders ask about for any service business: it shows whether revenue from last year's customers will still be there next year. A business that keeps 90% of its customers each quarter needs far fewer sales to hit the same target than one that keeps 75%, and it usually earns more loyalty per dollar spent on service.
Customer Lifetime Value
Customer lifetime value estimates how much revenue one account brings in across the relationship. A simple version multiplies average order value by purchase frequency by customer lifespan. For a recurring plan, expected lifespan is roughly 1 ÷ (1 − retention per billing cycle), so every point of retention you add stretches lifespan and lifts value. Comparing it with acquisition costs shows whether each new sign-up will ever pay for itself.
Net Promoter Score
The net promoter score asks how likely someone is to recommend you on a 0–10 scale, then subtracts the share of detractors from the share of promoters. It is a leading signal: a falling score often shows up a quarter or two before retention drops.
Repeat Purchase Rate
For shops without subscriptions, the repeat purchase rate — buyers who ordered more than once divided by all buyers — is often a more practical stand-in, since there is no formal cancellation event to count.
Customer Satisfaction Score and Customer Effort Score
The customer satisfaction score captures how pleased someone is right after an interaction, while the customer effort score measures how hard it was to get something done. High effort is one of the clearest predictors of a cancellation, even when satisfaction ratings look fine.
Profit- and Sales-Adjusted Variants
A profit-adjusted retention rate weights each kept account by its margin, so keeping one profitable client counts for more than keeping three loss-making ones. A sales-adjusted retention rate weights by revenue instead. Both help you see whether the accounts you keep are the ones that protect profit margins.
Strategies That Build Customer Loyalty and Renewals
Improving the number means changing what happens between sign-up and renewal. Research from Bain & Company is widely cited for finding that a 5% lift in retention can raise profits by 25% to 95%, which is why the work below usually beats another round of acquisition spend for long-term growth. The aim is a product and service experience so consistent that customers never have a reason to look elsewhere; loyalty grows from many small good moments, not one grand gesture.
Onboarding and Customer Experience
Most cancellations are decided in the first weeks. Strong onboarding, built around a personalized welcome checklist, gets each new account to its first real result quickly, and a consistent customer experience across email, in-app help and billing keeps that early momentum from fading.
Pricing, Upselling and Cross-Selling
Each tactic below aims to shrink the gap between your opening count and the accounts still paying at the close, which is exactly what the calculator measures; rerun it the following period to see whether the change moved the result.
- Offer tiered pricing so a client who outgrows or undergrows a plan can move instead of leaving.
- Use upselling when a client is hitting limits, not as a quota push.
- Use cross-selling to connect products that work better together, which raises the effort of switching away.
- Reward long tenure with personalized renewal offers rather than blanket discounts.
Dunning and Cancel Flows
Dunning — automated retries and card-update reminders — recovers payments that would otherwise become silent losses. Cancel flows give a leaving subscriber alternatives such as pausing, downgrading or a limited offer, which turns a one-click exit into a conversation.
Loyalty Programs and Customer Feedback
Well-designed loyalty programs give regulars a reason to stay that competitors cannot copy overnight, especially when the rewards are personalized to what each member actually buys. Pair them with a loop for customer feedback: collect it after key moments, act on the patterns, and tell people what changed. Log when each change ships, then check whether the next period's result from the calculator rises. Visible follow-through builds engagement and turns satisfied clients into brand advocates who bring in referrals.
Customer Support That Prevents Cancellations
Fast, capable customer support fixes the frustrations that would otherwise end the relationship. Track first-response and resolution times next to your retention figures; when one slips, the other tends to follow a few weeks later.
Tracking Renewing Customers Over Time in Excel or a CRM
A single result is a snapshot. The real value comes from running the same calculation every period and watching the line. Many teams start with Excel and move to a CRM or billing dashboard once the account list grows.
- Keep one spreadsheet row per period with the opening, new and closing counts plus two or three supporting metrics.
- Pull the counts from your billing system, not from memory or sales estimates.
- Chart the figure monthly so a sudden dip stands out immediately.
- Note product, price or support changes next to the row where they happened.
Cohort Analysis and Segmentation
Cohort analysis follows each sign-up month as its own group, which shows whether newer clients stay longer than older ones. Segmentation by plan, company size or channel shows where losses concentrate — often a single segment drags the overall average down.
Predictive Retention Modeling
Predictive retention modeling uses usage, support and billing signals to score each account's risk of leaving before it happens. Even a simple rule built on falling engagement, such as flagging accounts whose logins dropped by half, lets your team step in while there is still time.
Mistakes to Avoid When You Calculate Retention Rate
- Forgetting to subtract new sign-ups, which inflates the result and can even push it above 100%.
- Comparing a 30-day figure with a 12-month one from a report or a peer.
- Mixing logo counts and recurring revenue in the same calculation.
- Counting paused or trial accounts inconsistently between the start and the end of the window.
- Reading one period in isolation instead of the trend across several.
Get these right and your customer retention rate becomes one of the clearest reads on business stability and overall business health you have. The same logic even works for staff: an employee retention rate calculator uses the identical formula with employees and new hires in place of clients.
FAQs around Customer Retention Rate Calculator
1. How do I calculate the customer retention rate?
Subtract the new customers you gained during the period from the total customers at the end, divide the result by the customers you had at the start, and multiply by 100. For example, (671 − 118) ÷ 640 × 100 = 86.4%.
2. Why do new customers get subtracted?
Customers who joined during the period say nothing about your ability to keep the ones you already had. Leaving them in would inflate the result and can even push it above 100%.
3. Can the customer retention rate be negative?
No. The lowest possible result is 0%, which means every customer you started with left. If you get a negative number, the new customer count is larger than the ending total, which usually points to a data error.
4. What is the difference between retention rate and attrition rate?
They are two sides of the same figure. Retention is the share of starting customers who stayed; attrition (or churn) is the share who left. Together they always add up to 100%.
5. What is a good customer retention rate?
It depends on your industry and business model. B2B software with annual contracts often retains customers in the high 80s or 90s per year, while retail and consumer apps usually run lower. Compare against peers with a similar customer base and against your own past periods.
6. What is the customer retention rate if a business lost 25% of its customers?
If no new customers are counted, losing 25% of the starting base leaves a customer retention rate of 75%, because 75% of the original customers remained.
7. What is the difference between customer acquisition and customer retention?
Customer acquisition is about winning new customers, while customer retention is about keeping existing ones so they continue to bring in revenue. Keeping a customer is usually far cheaper than acquiring a new one.
Report an issue with this page
Spotted a wrong result or unclear explanation? Report an issue or read our editorial policy.