

GRP Calculator – Gross Rating Point & Rating Points Tool
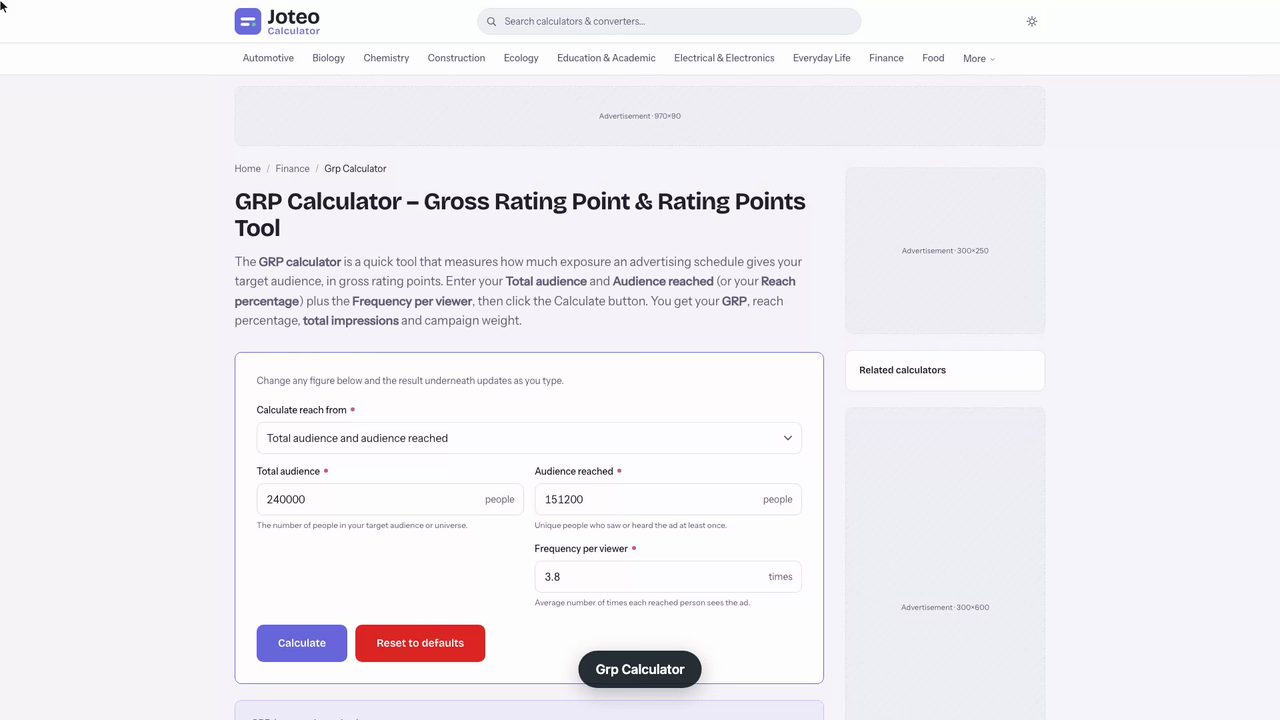
The GRP calculator is a quick tool that measures how much exposure an advertising schedule gives your target audience, in gross rating points. Enter your Total audience and Audience reached (or your Reach percentage) plus the Frequency per viewer, then click the Calculate button. You get your GRP, reach percentage, total impressions and campaign weight. Also try the Cltv Calculator.
Grp Calculator inputs and result
GRP (gross rating points)
—
- Reach percentage
- —
- Frequency per viewer
- —
- Total impressions
- —
- Rating points with frequency capped at 3
- —
- Reach efficiency (reach ÷ frequency)
- —
- Campaign weight
- —
Table of contents
Who wrote and checked this page


Before you sign off on a media schedule, you want one number that tells you how much weight it really carries. The GRP calculator gives you exactly that: enter your reach and frequency and it returns your gross rating point total, the figure that lets you calculate GRP-based exposure, compare television and radio plans, and judge campaign effectiveness before the budget for your advertising campaign is spent on the wrong target audience. You also see the impact in total impressions.
What Is GRP in Advertising? Gross Rating Points Explained
Gross rating points are the sum of all the ratings a schedule earns. One rating point equals 1% of your target universe seeing one airing, so GRP in advertising is a measure of total advertising exposure, not of unique people. In television advertising, advertisers and media buying teams have priced TV ads this way for decades, and the same logic now covers radio campaigns, digital display and multi-channel plans.
Because it puts every media plan on one scale, GRP helps you protect your marketing budget, compare commercials across broadcast channels, link spend to brand awareness, and estimate return on investment (ROI) for each campaign.
Reach Percentage and Frequency Per Viewer
Reach percentage is the share of your target audience exposed at least once during the advertising schedule. It's also called net reach or penetration, and it excludes duplication. Frequency per viewer is the average frequency: how many times each person or household reached saw the ad. Reach and frequency together describe how many viewers you touched and how hard.
GRP vs TRP: Target Rating Points
Target rating points (TRP) apply the same math to one demographic, such as adults 25-54, rather than the whole population. If your target market is narrow, a TRP rating is the better gauge of spend that actually lands on buyers.
GRP Calculation Formula for Media Planning
The GRP calculation formula multiplies reach (as a whole-number percentage) by average frequency:
$$\text{GRP} = \text{Reach}\,(\%) \times \text{Frequency}$$
Rearranged, it gives you the other two values, which is how media planning teams back into reach from a buy:
- GRP formula: \(\text{GRP} = \text{Reach} \times \text{Frequency}\)
- Reach: \(\text{Reach} = \text{GRP} \div \text{Frequency}\)
- Frequency: \(\text{Frequency} = \text{GRP} \div \text{Reach}\)
You can also add up the spot ratings of every airing: ten spots in a daypart that each earn a 2.4 rating point score deliver 24 GRPs.

Converting Audience Reached Into Reach %
If you know head counts rather than percentages, divide the audience reached by the total audience:
$$\text{Reach}\,(\%) = \frac{\text{Audience reached}}{\text{Total audience}} \times 100$$
Total Impressions and Gross Impressions
Total impressions, also called gross impressions, convert rating points back into raw exposure counts. Each gross impression is one chance for one person to see the ad, and 100 GRPs equals as many impressions as there are people in the universe:
$$\text{Impressions} = \text{Total audience} \times \frac{\text{GRP}}{100}$$
Cost Per Point (CPP) and CPM
Cost per point (CPP) divides schedule cost by GRPs. CPM, or cost per thousand, divides schedule cost by impressions and multiplies by 1,000. Both turn the GRP total into a price you can compare across stations.
How the GRP Calculator Works: A Worked Example
Say a regional furniture retailer plans a four-week radio ad flight aimed at 240,000 adults aged 25-54. The station's estimates show the schedule reaching 151,200 of them, each hearing it an average of 3.8 times, for a total cost of $28,700. Here's the GRP calculation the gross rating point calculator runs:
- Reach: \(151{,}200 \div 240{,}000 \times 100 = 63\%\)
- GRP: \(63 \times 3.8 = 239.4\) rating points
- Impressions: \(240{,}000 \times 239.4 \div 100 = 574{,}560\)
- CPP: \(\$28{,}700 \div 239.4 = \$119.88\) per point
- CPM: \(\$28{,}700 \div 574{,}560 \times 1{,}000 = \$49.95\)
So this ad campaign buys about 239 GRPs and nearly 575,000 exposures for under $50 per thousand.

Choosing Between Two TV Proposals With the Gross Rating Points Calculator
A credit union's marketing lead has two station proposals on the desk for a three-week home-loan push aimed at adults 35-64, a universe of 412,600 people. The question is simple: which schedule buys more useful weight per dollar? Short answer: on gross rating points alone, Proposal A wins at 217.58 GRPs for $190.05 a point, but that isn't where the decision ends.
She enters each proposal's station estimates in turn, reach first and then average frequency, and the gross rating points calculator returns:
| Proposal | Reach | Frequency | GRPs | Cost | CPP | CPM |
|---|---|---|---|---|---|---|
| A (38 spots, late news) | 47.3% | 4.6 | 217.58 | $41,350 | $190.05 | $46.06 |
| B (wider daypart mix) | 58.9% | 3.1 | 182.59 | $37,980 | $208.01 | $50.41 |
| B rerun, six spots added | 61.2% | 3.6 | 220.32 | $44,100 | $200.16 | $48.51 |
She cross-checks A by hand: 47.3 × 4.6 = 217.58, and 412,600 × 2.1758 = 897,735 impressions, which matches the station's own impression estimate within rounding.
What stands out is that B touches about 243,000 people against A's 195,000, yet costs more per point. The reference she weighs it against is the effective-frequency idea from Michael Naples' 1979 study, which put a useful minimum at around three exposures in a purchase cycle. A's 4.6 clears that comfortably; B's 3.1 average barely does.
That average is the trap. A 3.1 mean can hide a frequency distribution where a large share of the reached audience saw the spot only once, so B's real "reached three times" audience could be well under 58.9%. The calculator can't see that split. Before signing, she asks B's station for its frequency distribution report, not just reach and average frequency.
The sensitivity rerun settles her view: adding six spots to B lifts it to 220.32 GRPs at $200.16 a point, which beats A on both reach and total weight for $2,750 more. My judgement is that the input to watch here is frequency, not the GRP total, because it decides whether reach turns into recall. Her next step is to request B's distribution and price the six-spot version.
Reading Your GRP Score: Benchmarks and Limits
A GRP score can never be negative, since neither reach nor frequency can fall below zero. What it means for your brand depends on the goal.
GRP Benchmark Ranges for Campaign Effectiveness
There's no universal GRP benchmark. A short local promotion might run well under 100 GRPs a week, while product launches often stack several hundred across a flight. Judge campaign strength against your own past flights and the frequency your message needs, not a single cutoff.
Why the Same GRP Total Can Hide Duplication
Identical totals can describe very different plans. 239.4 GRPs could be 84% reach at 2.85 frequency, or 28% reach at 8.55. The second plan hammers a small group, which risks oversaturation, so check reach alongside the total and use frequency caps where your platform allows them.

FAQs around Grp Calculator
1. What does a GRP calculator measure?
It measures the total advertising weight of a schedule: reach percentage multiplied by average frequency. One gross rating point equals exposures to 1% of your target audience, so the result tells you how much exposure the plan buys, not how many unique people see it.
2. How do you calculate GRP?
Work out reach as a percentage (audience reached divided by total audience, times 100), then multiply it by the average frequency per viewer. For example, 63% reach at a frequency of 3.8 gives 239.4 GRPs.
3. Can GRP be negative?
No. Reach and frequency can't fall below zero, so their product can't either. A result of 0 means the schedule reached nobody or ran no airings.
4. What is the difference between GRP and TRP?
GRPs use the whole population or universe as the base. Target rating points (TRPs) apply the same math to one demographic, such as adults 25-54, so they show how much weight lands on the people you actually want to reach.
5. How do I turn GRPs into impressions?
Multiply the total audience by GRP divided by 100. A 240,000-person audience at 239.4 GRPs works out to 574,560 total impressions, because 100 GRPs equals as many impressions as there are people in the audience.
6. Is a higher GRP always better?
Not on its own. The same total can come from wide reach at low frequency or narrow reach at high frequency, and the second risks oversaturating a small group. Check reach and frequency alongside the GRP, and weigh it against cost per point.
7. What is a good GRP for a campaign?
There's no single target. Small local promotions often run well under 100 GRPs a week, while product launches tend to stack several hundred over a flight. Compare against your own past campaigns and the frequency your message needs.
Report an issue with this page
Spotted a wrong result or unclear explanation? Report an issue or read our editorial policy.