

Stock Beta Calculator: Find Any Stock's Beta vs the Market
The beta stock calculator measures how strongly a stock's price moves compared with the overall market. Paste your asset prices and the matching benchmark prices (such as an S&P 500 fund), oldest first, then click the Calculate button to get your stock's beta, a plain-language interpretation, and the covariance, benchmark variance and correlation behind it. Also try the Margin Interest Calculator.
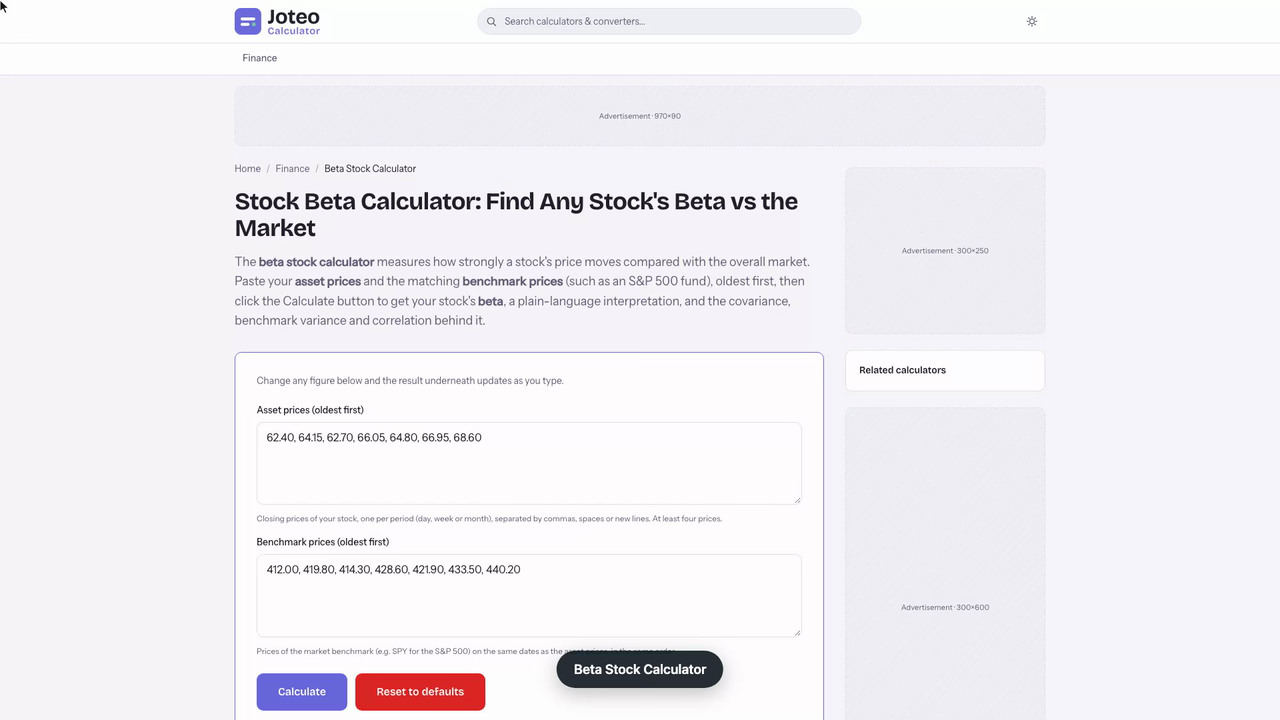
Beta Stock Calculator inputs and result
Your beta
—
- What it means
- —
- Number of returns
- —
- Covariance (asset & benchmark returns)
- —
- Variance of benchmark returns
- —
- Correlation coefficient
- —
Table of contents
Who wrote and checked this page


Wondering whether a stock will amplify the market's swings or soften them? Feed matched closing prices for the stock and its benchmark into the beta stock calculator and you get its beta coefficient: one number that says how far its returns tend to move for every 1% move in a broad index such as the S&P 500, which is the first question in any serious investment check.
How the Beta Stock Calculator Works
This free stock beta calculator asks for pairs of prices taken on the same dates: an asset price for the stock and a benchmark price for the market you compare it with. It needs at least four pairs, because three prices give only two returns, and a statistic built on two data points is noise. It converts each pair of consecutive prices into a percentage return, then compares how the two return series move together. See also our Graham Number Calculator.
Ticker-based tools work the same way behind the scenes: you type a stock symbol, they download the stock price history and run the identical maths. Sites such as Yahoo Finance and FinViz print a pre-computed beta on every stock screener page, but they rarely tell you which period they used, which is why entering your own prices is worth the minute it takes.
Choosing a Lookback Period and Benchmark
The lookback period changes the answer. The common convention is five years of monthly prices, which gives 60 monthly returns; one year of daily returns suits a short investment horizon but reacts to every news spike. For US stocks the usual choice is SPY, an ETF tracking the S&P 500; for tech names the NASDAQ-100 (via QQQ) is a closer market index.
What a Stock's Beta Measures
The plainest stock beta definition: beta (β) is the market sensitivity of a stock or other securities. It compares the stock's volatility with the volatility of the stock market as a whole, but only the part of it that moves together with the market.
- β = 1: the stock moves in line with the index.
- β above 1: the stock is more volatile than the market in both directions.
- β between 0 and 1: the stock is less volatile than the market.
Systematic Risk Versus Unsystematic Risk
Beta captures systematic risk, the market risk driven by macroeconomic forces like inflation and interest rates that no amount of diversification removes. Unsystematic risk is company-specific (a failed product, a lawsuit) and largely disappears in a well-diversified holding of 20 or more names, which is why beta is the exposure that still matters after you spread your money around.
Stock Beta Formula: Covariance Over Variance
Beta divides the covariance of stock returns with market returns by the variance of the market returns:
$$\beta = \frac{\text{Cov}(R_s, R_m)}{\text{Var}(R_m)}$$
Each return comes from historical prices: \(R_t = \frac{P_t - P_{t-1}}{P_{t-1}}\). The covariance tells you whether the two series rise and fall together and by how much; dividing by the benchmark's own variance rescales that into "stock move per 1% market move." Use the same frequency for both series, because mixing weekly and monthly historical returns breaks the comparison.
Beta as a Linear Regression Line
The same number falls out of a statistical approach most analysts already know: plot each period's stock return against the market return and fit a linear regression line. Its gradient is beta, and how tightly the points cluster around it tells you how much to trust the line: a beta built on a correlation of 0.3 explains little of the stock's movement.
How to Calculate Beta of a Stock: A Worked Example
Here is a fictional mid-cap industrial stock against an S&P 500 tracker over seven month-end closes (six returns, kept short so you can follow every step):
| Month | Asset price ($) | Benchmark price ($) | Stock return | Market return |
|---|---|---|---|---|
| 0 | 62.40 | 412.00 | n/a | n/a |
| 1 | 64.15 | 419.80 | 2.80% | 1.89% |
| 2 | 62.70 | 414.30 | -2.26% | -1.31% |
| 3 | 66.05 | 428.60 | 5.34% | 3.45% |
| 4 | 64.80 | 421.90 | -1.89% | -1.56% |
| 5 | 66.95 | 433.50 | 3.32% | 2.75% |
| 6 | 68.60 | 440.20 | 2.46% | 1.55% |
- Average the returns: 1.629% for the stock, 1.128% for the market.
- Multiply each pair's deviations from those averages and average the products: 0.000526 (a covariance calculator gives the same).
- Average the squared deviations of the market column: 0.000366 (check it with a variance calculator).
- Divide: 0.000526 ÷ 0.000366 = β ≈ 1.44.
Whether you use the population or sample version doesn't matter, as long as both use the same one: the divisor cancels out.

Reading Your Beta Value
A reading of 1.44 says the stock has historically moved about 1.44% for each 1% market move. On a 3% rally you would expect roughly 4.3% of upside; on a 5% sell-off, about a 7.2% loss. The correlation here is 0.99, unusually tight, so treat this as a teaching case; the beta of stock data in real life is far noisier.

Interpreting the Beta Coefficient
Read the beta coefficient by which band it falls in, and remember it describes direction and size of co-movement, not whether the stock will make money.

High Beta Stocks and Low Beta Stocks
High beta stocks (above about 1.3) are often growth stocks, young tech names or companies with a small market capitalization: they lead rallies and suffer the deepest drawdown in a market crash. Low beta stocks (below about 0.8) tend to be anti-recession businesses such as utilities and consumer staples, whose sales hold up when the economy turns volatile.
Zero and Negative Beta
Cash has a beta of zero: its value ignores the market. A negative beta means the asset tends to move in the opposite direction, which is true of put options, inverse ETFs and, at times, gold mining stocks. Investors use these as portfolio hedges, though a fund or mutual fund with a negative reading over one period can flip sign in the next.
Calculate Stock Beta in Excel
Excel does the whole job with built-in functions once your prices sit in columns:
- Put dates in column A, stock closes in B and index closes in C.
- In D3 enter
=(B3-B2)/B2and in E3=(C3-C2)/C2, then fill down. - Use the SLOPE function:
=SLOPE(D3:D8, E3:E8). - Cross-check with
=COVARIANCE.P(D3:D8, E3:E8)/VAR.P(E3:E8).
Both formulas return 1.44 for the table above. Note the order: stock range first, market range second; swapping them gives a different and meaningless number.
Sizing a New Position by Its Beta Value
The decision on the table: how much of an $84,300 account can go into a precision-instruments maker without pushing the whole account's beta above 0.95, a cap set because the existing mix sits at 0.82 and the plan is to stay below the S&P 500's own 1.0. The answer turns out to be about 12%, not the 15% first pencilled in.
I pull twelve month-end closes plus a starting close for the stock (38.72 rising to 45.15) and for an S&P 500 tracker fund (103.48 to 112.65), and enter them pair by pair, oldest first. The calculator turns them into twelve paired monthly moves and returns 1.62. A spreadsheet cross-check on the same columns gives 1.62 as well, so no pair was mistyped.
Next, I take the 1.62 the calculator returned and blend it with the account's existing 0.82 as a weighted average: at a 15% weight, 0.85 × 0.82 + 0.15 × 1.62 = 0.94. That clears the cap, barely. Solving for the weight that lands exactly on 0.95 gives 16.2%, so 15% leaves almost no room.
That thin margin is why I rerun the calculator on each half of the year separately:
| Window | Stock's reading | Account beta at 15% | Account beta at 12% |
|---|---|---|---|
| All 12 months | 1.62 | 0.94 | 0.92 |
| First 6 months | 1.46 | 0.92 | 0.90 |
| Last 6 months | 1.79 | 0.97 | 0.94 |
The recent half reads 1.79, and at that figure a 15% stake breaks the cap at 0.97. Twelve monthly moves is a thin sample next to the 60 that Yahoo Finance's five-year monthly convention uses, and when the latest months read higher, that is the figure I would rather plan around. The number to watch here is the recent-half figure, not the full-year one, because it is the one that fails the test.
So the order goes in at 12%, or $10,116, which keeps the account at 0.94 even on the harsher reading. The caveat: a figure built from twelve points can swing by 0.3 between windows, so I would rerun it each quarter as new closes come in, and trim if the recent figure climbs past 2.0, where 12% would push the account to 0.96.
What Is a Good Beta for Your Portfolio?
There is no universally good beta; it depends on your risk tolerance and risk profile. If your portfolio feels sluggish, adding stocks above 1 raises its sensitivity to rallies. If its price fluctuations keep you up at night, adding names below 1 calms it. Portfolio beta is simply the weighted average of the holdings' betas.
Beta also feeds the capital asset pricing model (CAPM), which sets an expected return as the Treasury bill rate plus β times the market premium. Portfolio managers, financial analysts and financial planners pair it with a risk-adjusted return measure such as the Sharpe ratio, so beta is one input to risk management and investment analysis, not a verdict on investing in a stock by itself.
Levered Beta vs Unlevered Beta
The beta you measure from prices is levered: it includes the effect of the company's debt. To compare businesses with different capital structures, or to value a private firm, analysts strip the borrowing out: You might also find our Black Scholes Calculator useful.
$$\beta_U = \frac{\beta_L}{1 + (1 - t)\frac{D}{E}}$$
where \(t\) is the tax rate and \(D/E\) the debt-to-equity ratio. A highly leveraged company carries a higher measured beta than its operations alone would justify. Unlevered beta is a valuation tool; it is not what the calculator above returns.
Limitations of Beta
Beta is backward-looking: it describes how a stock behaved over the window you chose, and a company that changes strategy or takes on leverage can behave differently long before its five-year figure catches up. It also says nothing about fundamentals such as earnings, cash flow or dividends, and recently listed companies lack enough history for a reliable number. Use it alongside a business analysis, never instead of one. Check out our Covered Put Calculator as well.
FAQs around Beta Stock Calculator
1. How is a stock's beta calculated?
Turn each pair of consecutive prices into a percentage return for both the stock and the benchmark, then divide the covariance of the two return series by the variance of the benchmark's returns. The result is beta: the average stock move for each 1% move in the market.
2. How many prices do I need?
The calculator needs at least four pairs of prices, which give three returns, but that is only enough to see how it works. For a figure you can rely on, use around five years of monthly prices (about 60 returns) or one year of daily prices.
3. Which benchmark should I compare my stock with?
Use the market the stock belongs to. For most US stocks that is the S&P 500, often tracked with the SPY ETF; for technology stocks the NASDAQ-100 (QQQ) can be a closer fit. Make sure the benchmark prices come from the same dates as the stock prices.
4. What is a good beta for a stock?
There is no single good value. A beta above 1 suits investors who accept bigger swings for more potential upside, while a beta below 1 suits those who want a calmer portfolio. Match it to your risk tolerance and to the rest of your holdings.
5. What does a negative beta mean?
A negative beta means the asset has tended to move in the opposite direction to the market: it rises when the market falls and falls when the market rises. Put options and inverse ETFs often show negative betas, which is why investors use them as hedges.
6. Why does my result differ from the beta on a finance website?
Published betas depend on the period, the return frequency and the benchmark used. Yahoo Finance, for example, uses five years of monthly returns. Change any of those and the figure changes, so compare like with like.
7. Can I calculate beta in Excel instead?
Yes. Put the stock's returns and the market's returns in two columns and use =SLOPE(stock_returns, market_returns), or =COVARIANCE.P(stock_returns, market_returns)/VAR.P(market_returns). Both give the same beta as this calculator.
Report an issue with this page
Spotted a wrong result or unclear explanation? Report an issue or read our editorial policy.