

RSI Calculator: Relative Strength Index (RSI) Tool
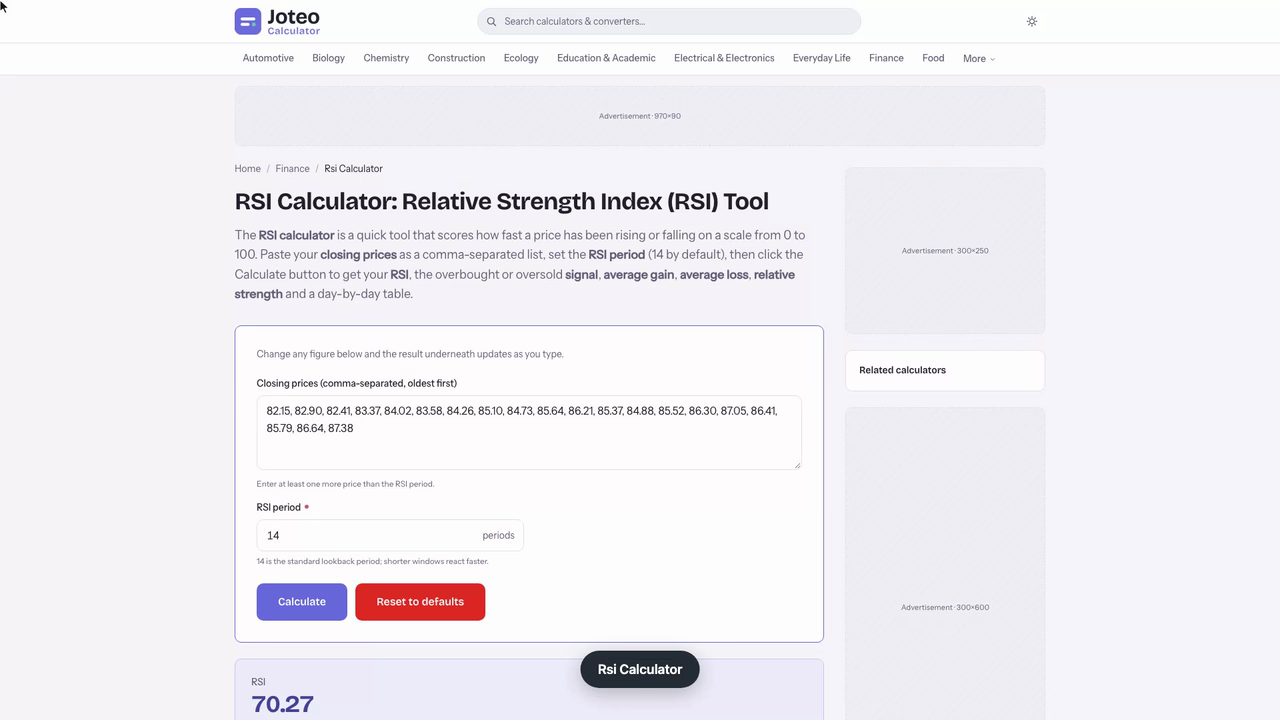
The RSI calculator is a quick tool that scores how fast a price has been rising or falling on a scale from 0 to 100. Paste your closing prices as a comma-separated list, set the RSI period (14 by default), then click the Calculate button to get your RSI, the overbought or oversold signal, average gain, average loss, relative strength and a day-by-day table. Also try the Long Call Calculator.
Rsi Calculator inputs and result
RSI
—
- Signal
- —
- Average gain
- —
- Average loss
- —
- Relative strength (RS)
- —
- Current price
- —
- Data points
- —
Results Table
Table of contents
Who wrote and checked this page


Use this RSI calculator to turn a list of prices into one number that shows how fast a stock is rising or falling. The Relative Strength Index is a momentum indicator that points to an overbought or oversold reading, so you can judge recent price action before you place an order.
How to Use the RSI Calculator
Think of it as a relative strength index calculator with only two inputs: a run of prices and a period. If you start from a stock symbol, pull its historical prices from your broker first. This technical indicator suits stocks, and investors can apply it to an ETF or any other asset the same way. See also our Black Scholes Calculator.
Enter your price data
Type or paste each price as a comma-separated list, oldest first. You need one more entry than your period, because the first entry only anchors the first change. Daily closes are standard, but weekly or hourly closes work if the spacing stays even.
Set the lookback period
The default setting is a 14-day window, where each trading period is one daily close. A shorter window is more reactive; a longer one is steadier.
Read the RSI results
You get the RSI, both averages and a signal. A reading under 30 is oversold, above 70 is overbought, and anything in between is neutral.
RSI Formula and Relative Strength Index Calculation
The RSI formula starts with relative strength (RS), the ratio of up moves to down moves, then normalizing it onto a scale between 0 and 100. J. Welles Wilder introduced it in 1978. You might also find our Margin Call Calculator useful.
$$RSI = 100 - \frac{100}{1 + RS}, \qquad RS = \frac{\overline{U}}{\overline{D}}$$
Here \(\overline{U}\) is the mean of the up moves and \(\overline{D}\) the mean of the down moves over your window. The more the closes rise, the larger RS and RSI become.
Average gain and average loss
Take each day's price changes, split them into gains and losses, and average each side as simple averages for the first reading.
Smoothing after the first reading
After that, each average is smoothed with Wilder's rule: multiply the previous average by 13, add the new move and divide by 14. Every new trading period nudges the RSI instead of resetting it, and a single large jump keeps echoing through the reading until later moves gradually absorb it.
Worked RSI Calculation on 20 Closing Prices
Take a stock that closes at 82.15, 82.90, 82.41, 83.37, 84.02, 83.58, 84.26, 85.10, 84.73, 85.64, 86.21, 85.37, 84.88, 85.52, 86.30, 87.05, 86.41, 85.79, 86.64 and 87.38. Those are consecutive closing prices, and the first 14 changes add up to 6.78 in gains and 2.63 in losses. Check out our Short Strangle Calculator as well.
| Step | Result |
|---|---|
| Average gain (6.78 ÷ 14) | 0.4843 |
| Average loss (2.63 ÷ 14) | 0.1879 |
| RS (0.4843 ÷ 0.1879) | 2.5779 |
| RSI on day 15 | 72.05 |
This RSI calculation gives an RSI value of 72.05. Smoothing lifts it to 74.26 on day 16, then it slides to 64.66 on day 18 after a two-day price decline, a short pullback, before ending at 70.27 on day 20. The same math works for any asset.
Check it by hand: RS of 2.5779 means the average up move was about two and a half times the average down move, and 100 − 100 ÷ 3.5779 returns the same 72.05 shown in the table. Always write the period next to any reading you quote, because a different window gives a different number.

Reading the RSI Value: Overbought and Oversold
Treat overbought or oversold readings as cautions, not orders. They help time entry and exit points and sharpen trading decisions, yet a stock in a steady market run can sit above 70 for weeks. Weigh a reading more when it lands near support and resistance.
| RSI range | Reading | What to watch |
|---|---|---|
| Above 70 | Overbought | A possible pullback |
| 30 to 70 | Neutral | No edge from RSI alone |
| Below 30 | Oversold | A possible price rebound |

Fit the thresholds to the name you follow. A slow, steady name may swing between 40 and 60 for months, so some traders tighten the bands to 80 and 20, while a fast mover may need 75 and 25 before a reading means anything.
Bullish and bearish divergence
Divergence appears when price makes a new extreme but RSI does not follow. A bullish case, a lower low in price with a higher low in RSI, can warn of trend reversals and gives stronger trading signals than a bare 30 cross.
Checking an Oversold Stock with a Relative Strength Index Calculator
A swing trader wants to know whether a utility share that has slid for three weeks deserves a starter position, which comes down to whether the selling is exhausted. After pulling the historical prices for the ticker, they paste 15 closes into the RSI calculator: 41.27, 40.85, 41.10, 40.32, 39.88, 40.15, 39.41, 38.97, 39.30, 38.52, 37.94, 38.20, 37.46, 36.91 and 37.08, keeping the standard 14-daylookback period.
The 14 changes hold 1.28 of up moves against 5.47 of down moves, so RS is 0.2340 and the RSI value is 100 − 100 ÷ 1.2340 = 18.96. That is far below Wilder's 30 line, a clearly oversold reading in technical analysis terms. Reading the RSI results takes seconds; deciding what to do with them takes longer.
I would cross-check before trusting it. Switching the RSI period to 9 gives 19.36, so the conclusion is stable. The number to watch is the level that ends the oversold state: one close of 38.07, a 0.99 bounce, lifts RSI to 30.02. The trader sets an alert there and treats it as the first of their entry and exit points instead of buying into the slide.
The caveat: after a price decline driven by an earnings miss, RSI can stay under 30 for weeks, and the buy reading turns into one of the false signals described above. Then the trader waits for the bounce to hold near support and resistance from the earlier range, sizes the first purchase at half, and lets this check inform their trading decisions rather than make them.
Setting the RSI Period for Your Trading Style
A shorter window is more reactive and raises sensitivity. On the 20 prices above, a 7-period RSI drops to 57.00 on day 18 and a 9-period one to 60.56, while the 14-period reading holds at 64.66. The standard 14 days setting suits most day-to-day use; a longer window fits an investment horizon of months and rides through quiet stretches better. An RSI price calculator works backwards from a target RSI and returns the closing price needed to reach 30 or 70.

When RSI Trading Signals Fail
RSI is a momentum oscillator, not a forecast, and it throws false signals when a stock grinds in one direction. A range-bound name may never reach either extreme. Most trading strategies use it for confirming trends, and sound technical analysis rarely rests on one tool, so treat the calculator's signal label as one input rather than a verdict.
Before you act on a reading, run three quick checks:
- Does the close sit above or below its recent average when your RSI result is extreme?
- Has your RSI result turned back from this level before?
- Does the wider market agree with the move?
Pairing RSI with a moving average
Check whether the close sits above a 50-day moving average; if it does and your RSI result is above 70, treat it as a weak reading. Faster and slower moving averages together give a second opinion. On a line chart, note whether an RSI dip lines up with common chart patterns in trading.
Bollinger Bands for volatility
Bollinger Bands widen when volatility rises, so when your RSI result hits 70 or 30, an extreme inside wide bands matters less than one that touches narrow bands.
FAQs around Rsi Calculator
1. What do overbought and oversold mean for RSI?
An RSI above 70 is usually called overbought, meaning the price rose quickly and may be due for a pullback. An RSI below 30 is called oversold, meaning a decline may be overdone and a rebound is possible. Both are cautions, not orders.
2. How is RSI calculated?
Over the chosen period the calculator averages the up moves and the down moves, divides the average gain by the average loss to get relative strength (RS), then applies RSI = 100 - 100 / (1 + RS). After the first value, each average is smoothed with Wilder's method.
3. Why is 14 the default RSI period?
J. Welles Wilder, who created the index, used 14 periods, and most platforms keep it as the default. You can use 7 or 9 for a more reactive reading, or 21 or more for a smoother one.
4. How many prices do I need to enter?
At least one more than your RSI period. A 14-period RSI needs 15 closing prices, because the first price only anchors the first change.
5. Is an RSI above 70 a sell signal?
Not by itself. In a strong advance RSI can stay above 70 for weeks. Treat it as a prompt to check other evidence such as a moving average, support and resistance or divergence.
6. Does RSI work for every asset?
It works for any asset with a price history, including stocks and ETFs, and it is most useful when the price swings enough to produce both gains and losses. It is less informative in flat markets or around sudden news shocks.
7. Can I use RSI with other tools?
Yes. Many traders pair it with a moving average, Bollinger Bands or chart patterns to confirm a trend or filter false signals.
Report an issue with this page
Spotted a wrong result or unclear explanation? Report an issue or read our editorial policy.