

Hotel Occupancy Rate Calculator: Formula & Examples
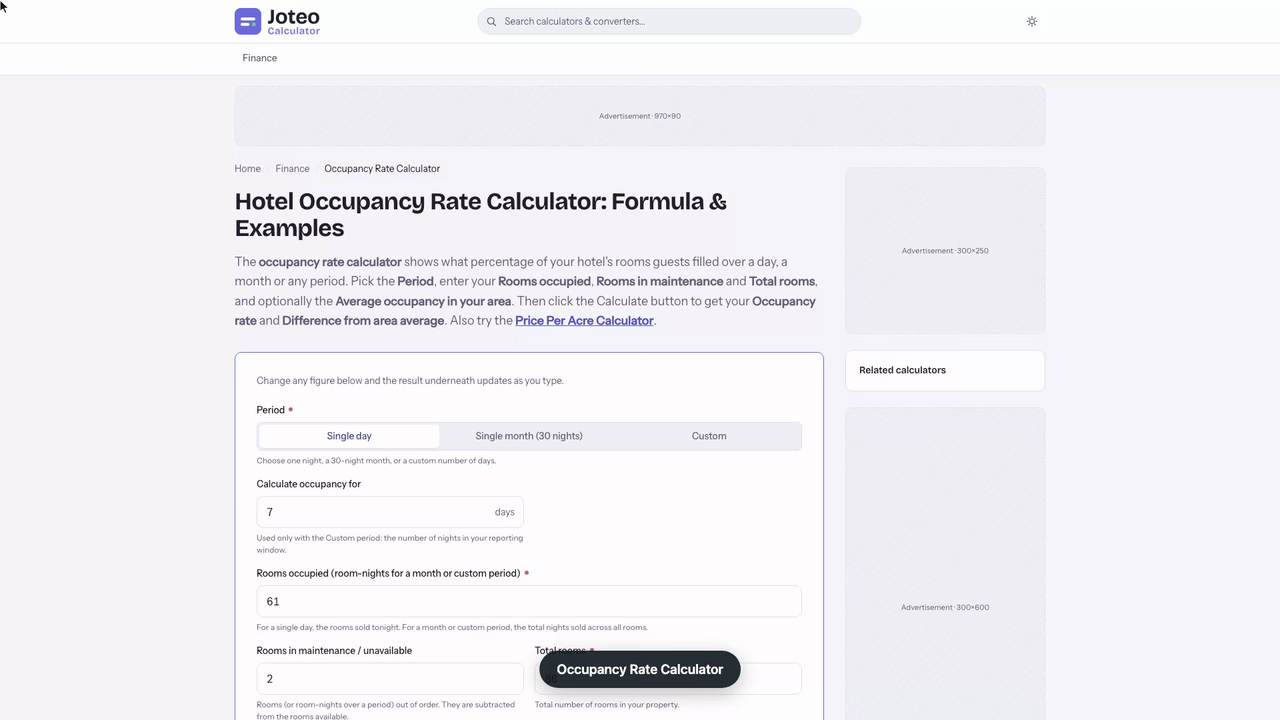
The occupancy rate calculator shows what percentage of your hotel's rooms guests filled over a day, a month or any period. Pick the Period, enter your Rooms occupied, Rooms in maintenance and Total rooms, and optionally the Average occupancy in your area. Then click the Calculate button to get your Occupancy rate and Difference from area average. Also try the Price Per Acre Calculator.
Occupancy Rate Calculator inputs and result
Occupancy rate
—
- Difference from area average
- —
Table of contents
Who wrote and checked this page


Empty rooms earn nothing, so the first number worth knowing about any hotel is how full it actually was. Our occupancy rate calculator takes the rooms you sold and the rooms you could have sold over a night, a week or a month and returns the share of your capacity that guests actually used, as a clean percentage you can compare against your own history and your market.
What the Occupancy Rate Measures
The occupancy rate is the proportion of sellable space that is in use during a set window. For a hotel, that space is guest rooms; for an apartment building it is leased units; for a hospital or an assisted living facility it is staffed beds. The result is always expressed as a percentage, where 100% means full occupancy and every available unit was taken.
Because it is a ratio, it lets a 40-room inn and a 900-room convention hotel compare how full they are in the same language. That is why it sits at the top of almost every hospitality dashboard and why it is usually the first of the KPIs an owner, lender or asset manager asks about. As a key performance indicator, it is a quick read on the financial health of any lodging business: every unoccupied room is income that can never be recovered, because tonight's room cannot be sold tomorrow. On its own, though, it tells you how well you filled the building, not how much money you made doing it or what it did for profitability, which is why the later sections pair it with price-based metrics.
Occupancy Rate vs. Vacancy Rate
The vacancy rate is the mirror image: the share of units that sat empty. The two always add up to 100%, so once you know one, you know the other.
$$\text{Vacancy Rate} = 100\% - \text{Occupancy Rate}$$
Lodging operators usually talk in occupancy, while landlords of long-term rental units tend to talk in vacancy, since a vacant unit is the exception they are trying to avoid. For property owners who depend on rent from tenants, even a few points of vacancy can decide whether a building covers its mortgage, so cash flow forecasts usually start from an expected occupancy figure. The math is identical either way.
Where Occupancy Is Measured Beyond the Hotel Industry
The same ratio shows up far outside the hotel industry. A few places it matters:
- Hotels, motels and short-stay accommodation, where occupancy rates are tracked every single night.
- Short-term rentals, where hosts watch their airbnb occupancy rate to decide whether a listing is priced right.
- Multifamily buildings and other rental property, where owners track leased units against total units.
- Hospitals and assisted living facilities, where bed occupancy drives staffing and funding.
- Office and retail buildings, where real estate investors weigh leased floor area against rentable area.
- Campgrounds, hostels and other tourism businesses, where pitches or beds replace rooms.
In every case, the thing that changes is the unit (room, bed, flat, square foot), not the formula. Property management firms that run mixed portfolios often call the same figure utilization, and compare occupancy rates across all their properties on one report.
The Occupancy Rate Formula: Occupied Rooms ÷ Total Rooms
The occupancy rate formula divides the rooms that were used by the rooms that could have been used, then multiplies by 100:
$$\text{Occupancy Rate} = \frac{\text{Number of Occupied Rooms}}{\text{Total Rooms Available}} \times 100$$
The numerator is the number of occupied rooms, meaning your rooms sold (paid stays, plus complimentary rooms if your reporting standard counts them). The denominator is every room you could legitimately have rented. Get the denominator wrong and every later metric inherits the error, so it is worth being precise about what goes into it before you calculate occupancy rate for any real reporting.
Single Nights vs. Room-Nights Over a Time Period
For a given day, the inputs are simple room counts: if you have 63 sellable rooms tonight and 51 are sold, occupancy is \(\frac{51}{63} \times 100 = 80.95\%\).
For any longer time period, switch to room-nights. Multiply the room count by the number of nights to get the denominator, and add up every night each room was sold to get the numerator:
$$\text{Period Occupancy} = \frac{\sum \text{room-nights sold}}{\text{rooms} \times \text{nights} - \text{out-of-order room-nights}} \times 100$$
Averaging thirty one-night percentages instead gives a slightly different answer whenever your available inventory changes during the month, so a room-night total is the cleaner basis for weekly, monthly or annual reporting.
Rooms Out of Service for Maintenance
A room with a burst pipe or a renovation crew in it cannot be sold, so most operators remove it from the denominator for the nights it was out of order. This is the difference between net occupancy (out-of-order rooms excluded) and gross occupancy (every physical room counted). Net occupancy measures how well sales and pricing performed; gross occupancy measures how well the building as a whole was used. Report whichever basis your owners or brand standard require, and say which one you used.

How to Use the Occupancy Rate Calculator
The tool above works for a single night or a full reporting period. Enter your figures in this order:
- Enter the total number of rooms in the building, or total room-nights for a period.
- Enter any rooms (or room-nights) out of order for maintenance, if you report on a net basis.
- Enter the number of occupied rooms for the same period.
- Click the Calculate button to see your occupancy percentage and the matching vacancy rate.
Keep all three inputs on the same basis. Mixing a nightly room count with a whole month's room-night total is the most common reason an occupancy rate calculation comes out implausibly high or low. The same occupancy calculator works for an apartment block or a clinic: just swap rooms occupied for leased units or filled beds, and the available rooms for the total you could have filled.
Hotel Occupancy Rate Worked Example: A 64-Room Boutique Hotel in April
Here is a full month run through the same steps. A boutique hotel has 64 rooms and April has 30 nights. Two rooms were closed for bathroom refits for 9 nights each, and the hotel sold 1,431 room-nights during the month at an average rate of $139.
| Step | Calculation | Result |
|---|---|---|
| Gross room-nights | 64 rooms × 30 nights | 1,920 |
| Out-of-order room-nights | 2 rooms × 9 nights | 18 |
| Net room-nights available | 1,920 − 18 | 1,902 |
| Room-nights sold | From the booking report | 1,431 |
| Net occupancy | 1,431 ÷ 1,902 × 100 | 75.24% |
| Gross occupancy | 1,431 ÷ 1,920 × 100 | 74.53% |
| Vacancy rate | 100% − 75.24% | 24.76% |
$$\text{Occupancy} = \frac{1{,}431}{1{,}902} \times 100 = 75.24\%$$
The 0.71-point gap between net and gross is small here because only 18 room-nights were lost to the refit. A property with a whole floor closed would see a much wider spread, which is exactly why the basis needs to be stated. To lift the month to 80%, the hotel would have needed \(0.80 \times 1{,}902 = 1{,}522\) room-nights, or 91 more nights sold, roughly three extra rooms a night.

Checking a Quarter Against the Comp Set with the Occupancy Calculator
It is the first week of October, and the revenue manager of a 118-room airport hotel has to explain the third quarter to the owners before their budget meeting. The monthly reports sit on her desk, but they were each run on slightly different bases, so she rebuilds the quarter from room-nights instead of averaging three percentages.
July 1 to September 30 is 92 nights. She enters 118 rooms × 92 nights = 10,856 gross room-nights. Room 214 was out of service for 23 nights after a sprinkler leak, so she enters 23 out-of-order room-nights, leaving 10,833 sellable. The property management system shows 8,947 room-nights sold for the quarter, including crew and walk-in business.
The calculator returns 82.59% occupancy on a net basis (82.42% gross). On its own that looks healthy. Then she opens the STR report for the same quarter: the six-hotel comp set ran at 84.7%. Dividing her figure by theirs gives an occupancy index of 97.5, under the 100 line that marks a fair share of the market. The hotel lost ground to its neighbours even while running above 80% full.
She needs to know how big the gap really is. At 84.7% of 10,833, the hotel would have sold 9,176 room-nights, so it was 229 room-nights short, about 2.5 rooms a night. Her pickup reports show where those rooms went: Monday to Thursday nights, when two competitors hold airline crew contracts.
She tests one fix in the calculator. An airline has asked for 14 rooms, four nights a week, for 13 weeks, which adds 728 room-nights to the same base. Rerunning with 9,675 sold gives 89.31% occupancy and an index of about 105.4. The quarter's occupancy rate now clears the comp set, so her recommendation to the owners is specific: sign the crew block for Monday to Thursday only, and hold weekend inventory for higher-rated leisure demand.
What Is a Good Occupancy Rate for a Hotel?
There is no single good occupancy rate. A figure that is excellent for a seasonal mountain lodge in its quiet months can be a warning sign for a city-centre business hotel in October, and city hotels rarely share a resort's calendar. The honest answer is "better than your own history for the same period, and in line with or above your comp set."
Industry benchmarks give a rough anchor. The average hotel occupancy rate in the United States has sat in the low-to-mid 60s for most recent years, according to STR and CoStar data, with big differences by region, chain scale and month. Use national figures only as context; the numbers that should shape decisions are your own and those of hotels competing for the same guests. Run your own figures through a hotel occupancy rate calculator for the same month last year before judging this year's result, and write down which basis you used so the comparison stays fair.
High Occupancy Rate vs. Low Occupancy Rate
A high occupancy rate usually signals strong demand, but if you are running close to capacity every weekend, it can also mean your room rates are too low and you are leaving money on the table. A low occupancy rate points to thin marketing, poor visibility on booking channels, prices set above what the market will bear, or a seasonal dip.
| Pattern you see | Likely cause | First thing to check |
|---|---|---|
| Near 100% on peak nights, sold out weeks ahead | Rate set too low | Raise weekend rates and add minimum stays |
| Strong weekends, soft Sunday to Wednesday | Leisure-heavy mix | Midweek corporate or group business |
| Below comp set all year | Visibility or price positioning | Channel listings, reviews and rate parity |
| Deep dips in the low season only | Seasonal demand | Off-season offers and event calendars |
Location and property type shape all of this. A resort accepts wide swings between peak and shoulder months, while an airport hotel expects steadier numbers year-round. Compare like with like before judging your own figure.
Occupancy Rate and the Revenue KPIs Hoteliers Pair With It
Occupancy tells you how many rooms you filled, not what you earned filling them. Operators read it alongside a handful of price-aware metrics so they can tell a busy hotel from a profitable one, and spot trends that neither number shows alone.
ADR – Average Daily Rate
The average daily rate is total room revenue divided by rooms sold. In the April example, 1,431 room-nights at $139 brought in $198,909, so the rate works out to exactly $139.00. It rises and falls with your pricing strategy; occupancy often moves the other way.
RevPAR – Revenue per Available Room
This metric blends both measures into one figure:
$$\text{RevPAR} = \text{ADR} \times \text{Occupancy Rate}$$
For April, \(\$139 \times 0.7524 = \$104.58\). The table below shows why this blended figure matters more than occupancy alone. Three pricing choices for the same month produce very different occupancy but almost the same income:
| ADR | Room-nights sold | Occupancy | RevPAR |
|---|---|---|---|
| $129 | 1,540 | 80.97% | $104.45 |
| $139 | 1,431 | 75.24% | $104.58 |
| $152 | 1,310 | 68.87% | $104.69 |
The cheapest option fills 109 more room-nights than the base case, but each of those extra stays still needs cleaning, laundry and staff time. When the blended figure is flat, the lower-occupancy, higher-rate option usually wins on profit.

TrevPAR and GOPPAR
TrevPAR (total revenue per available room) adds food and beverage, parking, spa and other spend to the room revenue, which rewards upselling. GOPPAR (gross operating profit per available room) goes one step further and subtracts operating expenses, so it shows whether filling rooms is actually making money. A busy hotel with a weak gross operating profit figure is often spending too much to win each booking. Both metrics divide by the same rooms-available figure you enter in the calculator above, so a higher percentage from it only lifts profit per room when each extra room sold earns more than it costs to service.
Occupancy Rate Index (ORI) and RGI: Benchmarking Your Competitive Set
The occupancy rate index compares your occupancy with the average of a defined competitive set, usually four to eight nearby hotels of similar class and size:
$$\text{Occupancy Index} = \frac{\text{Your Occupancy}}{\text{Comp Set Occupancy}}$$
If the April hotel's comp set averaged 68.5% in April, its ORI is \(75.24 \div 68.5 = 1.10\). An index above 1.00 means you captured more than your fair share of the market's room-nights; below 1.00 means competitors took it. The RGI (revenue generating index) runs the same comparison on revenue per room, and it is the better test of whether that extra share was bought with discounts.
- ORI above 1.00 but revenue index below 1.00: you are winning market share on price, not value.
- ORI below 1.00 but revenue index above 1.00: your rates are strong, but the hotel may be underexposed on booking channels.
- Both above 1.00: the pricing and the distribution are working together.
How Hoteliers Lift Occupancy Without Cutting Rate
Discounting is the fastest way for hotels to raise occupancy and the fastest way to give away margin. The approaches below fill rooms while protecting price:
- Use dynamic pricing tied to demand signals such as local events, pickup pace and the rates competitors are charging, rather than fixed seasonal rate cards.
- Shift mix toward direct bookings through your own booking engine, which lowers commission paid to OTAs and gives you guest data for future marketing.
- Use length-of-stay rules on peak nights so a sold-out Saturday also fills the Friday and Sunday shoulder nights around it.
- Sell room blocks to wedding parties, sports teams and conferences to fill predictable midweek gaps.
- Build value-added packages with local businesses, such as a dinner or tour partner, instead of discounting the room itself.
- Run loyalty programs that reward repeat stays and referrals, since returning guests cost far less to win.
- Keep a channel manager in sync so every room is visible on every channel without overbooking risk.
Whatever mix you choose, rerun the calculator on the same net or gross basis before and after each change, with the same rooms-available figure, so you can see which tactic actually moved the percentage. Pair every tactic with the guest experience it creates, too: a full house that leaves reviews complaining about slow check-in costs you occupancy next season.
How Often to Track Hotel Occupancy
Occupancy is a moving figure, so the value comes from watching it at several speeds at once. Each cadence answers a different question for revenue management, operations and ownership:
- Daily: tonight's and the next two weeks' on-the-books occupancy tell the front office whether to open or close discounted rates, and help the housekeeping manager set staff schedules.
- Weekly: pickup reports show short-term trends, such as a midweek slump that calls for targeted promotions to corporate accounts.
- Monthly: the full-month hotel occupancy rate, ADR and RevPAR go to owners as the core read on financial performance.
- Quarterly: comparing the quarter with the same one last year strips out seasonality and shows whether your share of market demand is growing.
- Annual: the yearly average occupancy rate feeds budgeting, forecasting and any valuation of the building.
During peak seasons, a new competitor opening, or a trial of a new pricing rule, check the numbers more often than usual so you can react before the specific period you are trying to fill has passed.
FAQs around Occupancy Rate Calculator
1. How do you calculate occupancy rate?
Divide the rooms occupied by the rooms available, then multiply by 100. For a period longer than one night, use room-nights: total rooms times the number of nights, minus any room-nights out of order for maintenance.
2. Should rooms in maintenance count toward occupancy?
Most operators remove out-of-order rooms from the denominator, which gives net occupancy. Keeping them in gives gross occupancy, which is always slightly lower. Pick one basis and use it consistently in every report.
3. What is a good occupancy rate for a hotel?
There is no single target. Location, property type and season all move it, so the fairer test is whether you beat your own figure for the same period last year and the average of comparable hotels nearby.
4. What does a high occupancy rate mean?
It usually means strong demand, but a hotel that sells out far in advance may be pricing rooms too low. Check it against your average daily rate and RevPAR before assuming it is good news.
5. What does a low occupancy rate mean?
The hotel is not attracting enough guests for its capacity. Common causes are prices above what the market will pay, weak visibility on booking channels, thin marketing or a seasonal slump.
6. What is the difference between occupancy rate and vacancy rate?
They are two sides of the same figure. Vacancy rate is 100% minus the occupancy rate, so 80% occupancy means 20% of available rooms sat empty.
7. What is the occupancy rate index?
The occupancy rate index (ORI) divides your occupancy by the average occupancy of your competitive set. A value above 1 means you are taking more than your fair share of market demand; below 1 means competitors are.
8. Does a higher occupancy rate always mean more revenue?
No. Occupancy only counts rooms filled, not what each one earned. A hotel with lower occupancy but higher room rates can bring in more revenue, which is why occupancy is read alongside ADR and RevPAR.
Report an issue with this page
Spotted a wrong result or unclear explanation? Report an issue or read our editorial policy.