

Moving Average Calculator – Simple Moving Average (SMA)
The moving average calculator is a free tool that averages your numbers over a sliding window so you can see the trend behind the noise. Paste your Data Input, set the Length of the moving average, pick the simple, weighted or exponential Method, then click the Calculate button. You get the Latest moving average, every value in your time series, and whether your last value sits above or below it. Also try the Synthetic Stock Calculator.
Moving Average Calculator inputs and result
Latest moving average
—
- Moving average values
- —
- Last value vs moving average
- —
- Number of moving average points
- —
- Method
- —
Results Table
Table of contents
Who wrote and checked this page


Got a column of numbers that jumps around too much to read? The simple moving average calculator takes your data points, averages them over a span that slides forward one step at a time, and hands back a smoothed series of moving average values. You get the mean of the last few points at every position, so the real trend shows through the noise, whether you track a share, weekly sales or a lab measurement.
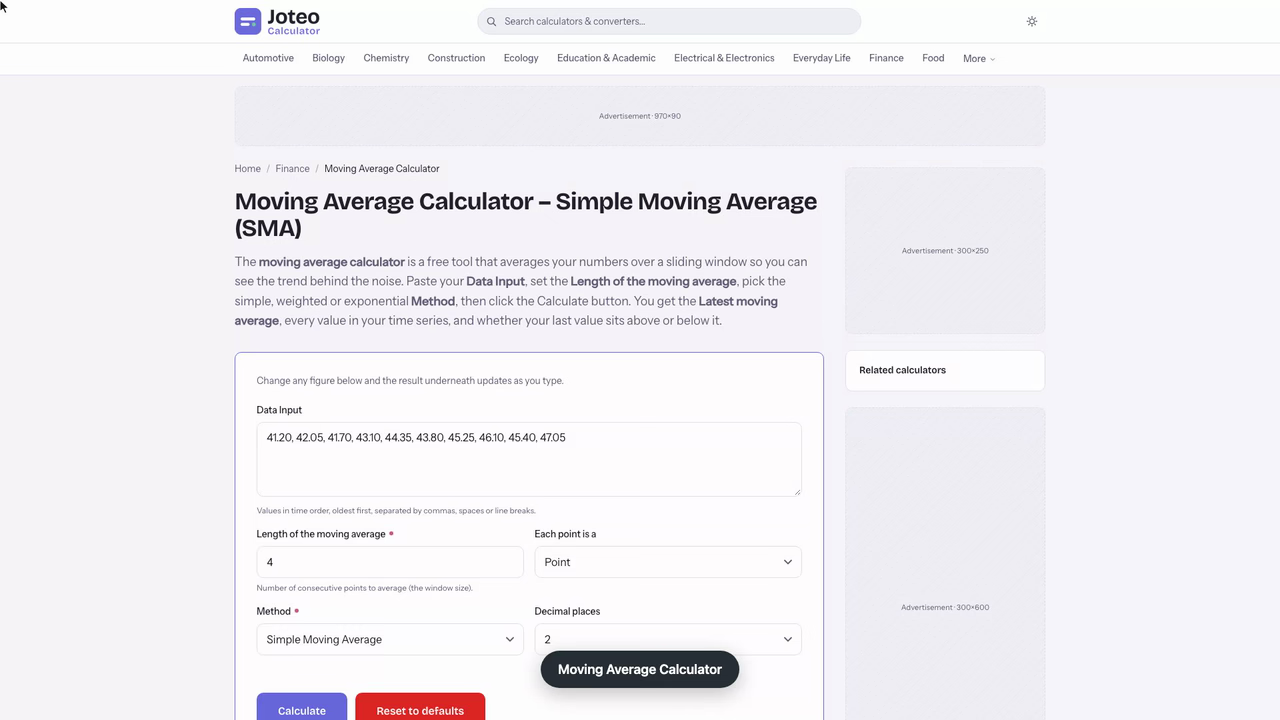
Using the Moving Average Calculator Step by Step
The tool needs only two things from you: a sequential data set and the length of the moving average. Everything else is arithmetic it does for you.
- Paste or type your values in time order, oldest first, separated by commas, spaces or line breaks. Copying a column straight from a spreadsheet works.
- Enter the length, for example 4 for weekly figures or 7 for daily data.
- Click the Calculate button to get one moving average for each full set of k values.
With n observations and a length of k, the online moving average calculator returns n − k + 1 results. Ten weekly values with a length of 4 give seven averages. The first answer appears only once four values are in, which is why the smoothed line always starts later than the raw one. The same steps apply to monthly data, hourly readings or any other evenly spaced series; the moving averages calculator doesn't care what the numbers represent, only that they are in order. Some people call it an MA calculator for short.
Simple Moving Average Formula
A moving average is a series of means taken over overlapping slices of your data. The simple moving average (SMA) gives every value in the slice an equal weight, so the formula is a plain average of the latest k values: See also our Beta Stock Calculator.
$$SMA_k = \frac{p_{n-k+1} + p_{n-k+2} + \dots + p_n}{k} = \frac{1}{k}\sum_{i=n-k+1}^{n} p_i$$In words: add up the latest k values and divide by k. For a price series that is the sum of the prices in the span divided by the number of time periods. Each subset overlaps the previous one in all but one place, which is what makes the average "move".
You don't need to re-add the whole window each step. When the moving average steps forward, the new value enters and the oldest value drops out:
$$SMA_{next} = SMA_{prev} + \frac{p_{n+1} - p_{n-k+1}}{k}$$Software that runs this on live feeds keeps the latest values in a FIFO queue or circular buffer, so each update is one subtraction, one addition and one division, however long the period.
Worked SMA Example on a Ten-Week Time Series
Say you track the Friday closing prices of a share for ten weeks and want a 4-week SMA. Here is the time series and every moving average value it produces, rounded to two decimals:
| Week | Close ($) | 4-week SMA ($) |
|---|---|---|
| 1 | 41.20 | – |
| 2 | 42.05 | – |
| 3 | 41.70 | – |
| 4 | 43.10 | 42.01 |
| 5 | 44.35 | 42.80 |
| 6 | 43.80 | 43.24 |
| 7 | 45.25 | 44.13 |
| 8 | 46.10 | 44.88 |
| 9 | 45.40 | 45.14 |
| 10 | 47.05 | 45.95 |
The first value is (41.20 + 42.05 + 41.70 + 43.10) ÷ 4 = 168.05 ÷ 4 = 42.01. For week 5 the shortcut gives 42.0125 + (44.35 − 41.20) ÷ 4 = 42.80. Notice how the dip in week 6 (43.80) barely dents the moving average, which keeps climbing: that smoothing absorbs single-week wobbles. By week 10 the close sits $1.10 above its 45.95 average, a sign the recent push is stronger than the month behind it. All four weights here are 0.25.

Window Size and Lag in a Rolling Average
The window size is the one setting that changes everything. A short window follows the data closely but keeps much of its noise; a long one gives a cleaner line that reacts late. A backward-looking average trails real changes by about (k − 1) ÷ 2 steps, so a 4-week span has a lag of 1.5 weeks and a 200-day moving average reacts roughly 100 trading days behind.
- A 7-day span removes day-of-week effects from daily counts.
- A 12-month span strips annual patterns out of monthly figures.
- A 30-day moving average suits swing views of a share; the long-run line most traders watch covers about 40 weeks.
Keep the length well under a third of your series, or the rolling average rests on too few points to say much.
Central Moving Average vs a Trailing Window
A trailing average uses only past values, which is what you need in real time. A central moving average instead takes an equal number of points either side of each position, so the sample window lines up with the data and the delay disappears. The cost: it needs future values, so it only works on history. Use an odd length for a centered average so there is a true middle point.
SMA Trend Analysis: Uptrend, Downtrend or Sideways
For trend analysis, compare the latest value with its SMA and watch the slope of the line itself: You might also find our Black Scholes Calculator useful.
- Uptrend: values hold above a rising moving average, as in the ten-week example.
- Downtrend: values stay below a falling average.
- Sideways: the line runs flat and values criss-cross it often.
The gap between a value and its average is called the deviation oscillator. Positive readings put the series above its trend; negative ones put it below. In the example, week 10's +1.10 says the latest close is running ahead of its 4-week price direction. Moving averages smooth short-term fluctuations so you can see the long-term trends underneath, but they describe what has happened; they don't forecast what comes next.
Crossover Analysis with Two SMA Lines
Crossover analysis runs two SMAs at once, a fast one (short window) and a slow one (long window). When the fast line moves through the slow one, short-term momentum has changed relative to the long-run average. The same idea works on weekly sales or website visits, not only on shares, and many analysts use it to mark trend reversals on any business series.
Golden Cross and Death Cross
A golden cross happens when the fast SMA, often the 50-day, crosses above the slow long-term line. A death cross is the reverse. Both are lagging signals: they confirm a move that has already started. In choppy, flat stretches the two lines tangle repeatedly and throw off false signals, so treat a cross as a prompt to look closer, not as a trade on its own.
SMA on Stock Price Data: Support and Resistance
Investors plot a moving average indicator straight on a stock chart, on an index ETF or on a single share. On stock price data the line often acts as dynamic support in a rising market (dips stop near it) and as resistance in a falling one (rallies stall under it). Traders read it as a gauge of market sentiment: while the stock holds above its average, buyers are in control.
Because it averages out price fluctuations, the SMA is one of the simplest tools in technical analysis. It is also the base for others, such as Bollinger Bands and MACD. One caution for trading: an average price line says nothing about volatility, valuation or news, so pair the technical indicator with volume and fundamentals before acting on it.
Using Moving Averages to Check a Fridge Swap on a Smart Meter
I replace a 14-year-old fridge-freezer on a Monday and want one answer: did my electricity use really fall, or am I seeing a quiet week? The 7-day average dropped from 9.15 kWh to 8.31 kWh a day, a cut of 0.84 kWh, so the swap is working, but more slowly than I hoped.
My smart-meter app gives daily totals, so I copy 14 of them, seven before the swap and seven after: 8.62, 9.14, 8.37, 8.95, 10.41, 9.88, 8.71, then 7.93, 8.06, 7.71, 8.24, 9.36, 9.02, 7.88. I set the length to 7 because my Saturday and Sunday readings run high (10.41 and 9.88 here), and a 7-day span holds each weekday exactly once.
The calculator returns eight values: 9.154, 9.056, 8.901, 8.807, 8.706, 8.556, 8.433, 8.314. I check the first by hand: 64.08 ÷ 7 = 9.154. Only the first and last are "clean"; the six in between mix old-fridge and new-fridge days, which is why the line slides down gradually instead of stepping.
| Length | Last value (kWh/day) | What it shows |
|---|---|---|
| 3 days | 7.90 (day 14), 8.87 (day 12) | Jumps whenever a weekend enters |
| 5 days | 8.44 | Two weekend days in five: biased up |
| 7 days | 8.31 | One full week, fair comparison |
That sensitivity rerun is the part worth remembering. A 3-day average after the swap ranges from 7.90 to 8.87 depending only on where the weekend falls, so a short length could have "proved" a saving of 1.25 kWh or almost none.
Next I put the final average against an outside benchmark. Ofgem's typical domestic consumption value for a medium electricity user is 2,700 kWh a year, about 7.40 kWh a day, so even at 8.31 my home sits 0.91 kWh a day above typical. The 0.84 kWh drop between the first and last averages is worth about £78.89 a year at the 25.73p per kWh on my bill, a payback of roughly 5.5 years on the £429.99 fridge.
My caveat: one week after is a thin sample. The heating came on in week two, which pushes usage up, so the true saving may be larger. I'll rerun with 28 days after the swap and compare 7-day values from the same weekday before I decide whether the next target is the tumble dryer.
Exponential Moving Average vs SMA
The exponential moving average (EMA) gives more weight to recent observations, with each older value counting a little less and never quite zero. Its weighting factor is α = 2 ÷ (k + 1), so a 4-period EMA puts 40% on the latest value: Check out our Long Put Calculator as well.
$$EMA_t = \alpha \times p_t + (1 - \alpha) \times EMA_{t-1}$$Seeded with the first SMA (42.01), the 4-week EMA on the example series ends at 45.87 in week 10, against 45.95 for the SMA. The difference is small here because the climb was steady; after a sharp turn, the EMA catches up noticeably sooner. Pick the SMA when you want an even, easy-to-check average, and the EMA when speed matters more than smoothness.

Weighted Moving Average and Cumulative Average
A weighted moving average (WMA) uses weights that fall in a straight line: the newest value gets k, the one before it k − 1, down to 1. The divisor is the sum of the weights, k(k + 1) ÷ 2, which is 10 for a 4-week window. For week 10 that is (4 × 47.05 + 3 × 45.40 + 2 × 46.10 + 1 × 45.25) ÷ 10 = 46.19, closer to the latest close than either the SMA or the EMA.
A cumulative average has no window at all: it is the average of everything up to now. Across all ten weeks it is 44.00. You can update it without storing the history:
$$CA_{n+1} = CA_n + \frac{x_{n+1} - CA_n}{n+1}$$It is handy for a running cost per unit, but it gets slower to react the longer the series runs.

Moving Median: A Rolling Mean Alternative for Outliers
A single spike can drag an average a long way. A moving median takes the middle value of each span instead, so one bad reading has far less pull. Picture a window of 12, 13, 95, 14 and 13: the mean is 29.4, while the median is 13. If your data carries outliers such as data-entry errors, sensor glitches or one-off promotions, run a moving median alongside the SMA and compare the two lines. Where they agree, the trend is real; where they split, an extreme value is distorting the average.
Running Average in Statistics and Signal Processing
Outside finance the same tool goes by other names: running average, moving mean, rolling mean or, for time-based data, a time average. In statistics moving average smoothing is a basic step for any ordered series. In signal processing it is a convolution of the data with a flat kernel, called a boxcar filter, and it behaves as a simple low-pass filter that lets slow changes through and damps fast ones. Economics teams smooth GDP and job figures this way, and epidemiology uses 7-day averages of daily cases to cancel weekend reporting gaps. In each field the method is the same as in the calculator above; only the length changes to match the cycle you want to remove.
Preparing Your Data Set for an SMA
Most odd results trace back to the input, not the formula. Before you calculate, check your data set:
- Even spacing: every value should cover the same interval. Fill or resample gaps first, or each average mixes different spans of time.
- Order: list values oldest to newest. Reversed data-points give a mirror-image line.
- Seasonality: if a pattern repeats every 12 months, a window of that length removes it. That deseasonalization is useful for spotting a trend but hides the seasonal swing itself.
- Enough length: you need at least k values, and many more points for meaningful smoothing.
FAQs around Moving Average Calculator
1. How do I work out a moving average by hand?
Choose the length, add up the first that many values and divide by the length to get the first average. Then drop the oldest value, add the next one, and divide again. Repeat until you reach the end of your data.
2. How do I calculate a 200-day moving average?
Add the closing values of the last 200 days and divide by 200. Each new day, drop the oldest day, add the newest and divide by 200 again. You need at least 200 days of data before the first value appears.
3. What does it mean when the price crosses its moving average?
A value moving from below to above its average suggests the trend may be turning up; a move from above to below suggests it may be turning down. A single cross is a hint, not proof, so check it against longer averages or other data.
4. What is the difference between SMA, EMA and WMA?
The SMA gives every point in the window equal weight. The WMA gives the newest point the most weight and the oldest the least, in a straight line. The EMA weights recent points most and keeps a small, shrinking weight on all older data, so it reacts fastest.
5. How do I choose the right length?
Match it to the noise you want to remove: 7 for day-of-week effects in daily data, 12 for seasonality in monthly data, and longer lengths for long-term trends. Shorter lengths react faster but stay noisier.
6. Why are there fewer moving average values than data points?
The first average needs a full window, so a length of k gives n - k + 1 results from n values. The first k - 1 points have no moving average.
7. What is a golden cross?
It is when a short moving average, often the 50-day, crosses above a long one, often the 200-day. The reverse is a death cross. Both confirm a move that has already started rather than predicting it.
Report an issue with this page
Spotted a wrong result or unclear explanation? Report an issue or read our editorial policy.