

Levered Free Cash Flow Calculator: LFCF Formula & Example
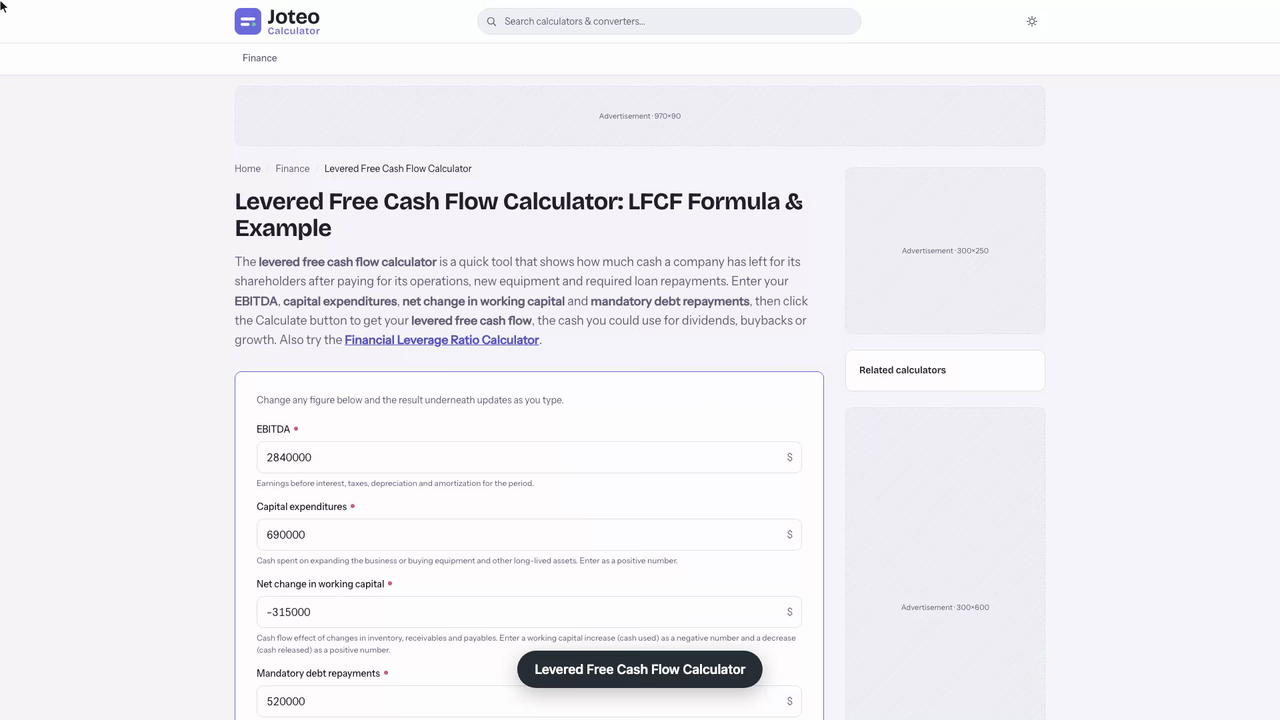
The levered free cash flow calculator is a quick tool that shows how much cash a company has left for its shareholders after paying for its operations, new equipment and required loan repayments. Enter your EBITDA, capital expenditures, net change in working capital and mandatory debt repayments, then click the Calculate button to get your levered free cash flow, the cash you could use for dividends, buybacks or growth. Also try the Financial Leverage Ratio Calculator.
Levered Free Cash Flow Calculator inputs and result
Levered free cash flow
—
Table of contents
Who wrote and checked this page


A company can post record profits and still have almost nothing left once the banks are paid, and the levered free cash flow calculator shows you exactly how much is left. Enter your operating earnings, the change in working capital, capital spending and the mandatory debt payments for the period, and you get levered free cash flow, the cash that actually belongs to shareholders. That single number tells you whether the business can fund dividends, buy back stock or grow without borrowing more, which is why it sits at the centre of owner-focused free cash flow analysis.
What Levered Free Cash Flow Measures
Levered free cash flow (LFCF) is the residual cash a company generates after it has covered its operating costs, its reinvestments in working capital and fixed assets, and every scheduled payment to its creditors. Analysts also call it free cash flow to equity (FCFE), because the money that remains is owed to nobody but the owners. The word "levered" signals that the business carries leverage: part of its capital was borrowed, and the people who lent it get paid before anyone who holds shares.
Plain free cash flow stops after operating expenses and capital spending. The levered version goes one step further and subtracts the claims of debtholders, so it answers a narrower and more practical question: how much cash could management hand to its owners this year without missing a loan payment?
Once the financial obligations are met, management decides what to do with the remainder. The usual options are:
- Dividends paid in cash to preferred and common owners
- A stock buyback that retires shares and lifts each remaining owner's stake
- Reinvestment in growth opportunities, such as new equipment or hiring
- Acquisitions of smaller competitors or suppliers
- Early repayment of debt to reduce future interest costs
Why Equity Holders Track Levered Free Cash Flow
For owners, it is a direct read on financial health. A business with high and stable cash flow after its debt obligations has discretionary cash to spare, more room to take on new loans and lower credit risk. A business with thin or erratic numbers has less of all three. The pattern is easy to summarise:
- High LFCF: more discretionary cash, greater debt capacity, lower credit risk
- Low LFCF: little cash left for owners, a tighter borrowing limit and higher risk if sales fall
- Negative LFCF: the company needs new share capital, new debt or cash reserves to cover the gap
Because it shows what investors can realistically receive, the metric also connects straight to the stock price. A company that grows the cash available to owners year after year tends to be rewarded with a higher valuation, while one that borrows to pay dividends usually is not.
Levered Free Cash Flow Formula
There are two common ways to write the levered free cash flow formula. Both land on the same idea (cash for owners after creditors are paid), but they start from different lines of the accounts, and they can give different answers if you are not careful about interest and taxes.
The EBITDA-Based LFCF Formula
The shortcut version starts from operating earnings before interest, taxes and non-cash charges. It is the version most online tools use, including this one:
$$\text{Levered FCF} = \text{EBITDA} - \Delta \text{NWC} - \text{CapEx} - \text{Mandatory Debt Payments}$$Where:
- EBITDA is operating earnings before interest, taxes, depreciation and amortization, taken from the income statement
- \(\Delta \text{NWC}\) is the change in net working capital: current assets minus current liabilities, compared with the prior year
- CapEx is capital expenditures: cash spent on property, plant and equipment (PP&E) and other long-lived assets
- Mandatory principal is the scheduled amount the loan agreements require this period
This shortcut is quick, but it quietly assumes that interest and taxes are either already captured elsewhere or small enough to ignore. For a company with meaningful borrowing, that assumption overstates the result, which is why the second method exists.
The Net Income Method for FCFE
The fuller version starts from the bottom line, so interest expense and taxes are already deducted:
$$\text{Cash to owners} = \text{Net Income} + \text{D\&A} - \Delta \text{NWC} - \text{CapEx} + \text{Net Borrowing}$$Depreciation and amortization is added back because it is one of the non-cash expenses: under accrual accounting, the cost of a fixed asset is spread across its useful life, but the cash left the business when the asset was bought. Net borrowing equals new debt borrowing minus debt principal repaid. It is negative when the company repays more than it raises, and positive when fresh loans bring cash in. Because the net-income starting point already reflects interest expense and the interest tax shield, this version matches the definition of owner cash more precisely.
How to Use the Levered Free Cash Flow Calculator
The tool follows the shortcut method above, so you need four figures for the same period, all in the same currency and scale. Use this levered free cash flow calculator with annual numbers unless you are deliberately working with a trailing twelve-month window.
- EBITDA: take operating income and add back D&A, or start from the bottom line and add back interest expense, taxes and D&A.
- Net change in working capital: enter an increase as a positive number, because extra stock or receivables absorb cash. Enter a decrease as a negative number.
- Capital expenditures: the cash spent on long-lived assets during the period, found under investing activities on the cash flow statement.
- Mandatory debt repayments: scheduled principal only, not optional prepayments and not interest.
- Click Calculate to see the levered free cash flow result, then compare it with prior periods to see the trend.
A positive result means the company generated cash for its owners after covering every required claim. A negative one means the period consumed cash, and the rest of this guide explains how to tell a healthy negative from a warning sign.
Levered Free Cash Flow Example: A Regional HVAC Distributor
Suppose you are looking at a regional heating and air-conditioning parts distributor that took out a term loan three years ago to open a second warehouse. For its latest fiscal year, the figures below come from its financial statements (in thousands of dollars).
| Line item | Amount ($000s) | Where it comes from |
|---|---|---|
| EBITDA | 2,840 | Operating profit plus D&A add-back |
| Increase in net working capital | 315 | Higher inventory and accounts receivable |
| Capex | 690 | New delivery trucks and racking |
| Mandatory debt payments | 520 | Term loan amortization schedule |
| Levered free cash flow | 1,315 | Result |
Plugging the numbers into the formula:
$$\text{LFCF} = 2{,}840 - 315 - 690 - 520 = \$1{,}315\text{k}$$So the distributor kept $1,315,000 for its owners, about 46% of its operating earnings. The working capital increase is a cash outflow: stocking more compressors and extending more credit to contractors tied up $315,000 that would otherwise have been free. Had working capital fallen instead, it would have been a cash inflow and a source of cash that lifted the result.

Cross-Checking the Levered Free Cash Flow Calculation Against the Bottom Line
The same company paid $312,000 in interest and had $438,000 of D&A. That gives EBIT of $2,402,000, pre-tax income of $2,090,000, taxes at 25% of $522,500 and net income of $1,567,500. Running the net-income method:
$$\text{Cash to owners} = 1{,}567.5 + 438 - 315 - 690 - 520 = \$480.5\text{k}$$The gap between $1,315,000 and $480,500 is exactly the $834,500 of interest and taxes the shortcut never subtracts. For a lightly indebted company that gap is small. For this distributor it cuts the cash available to owners by almost two-thirds, which is why you should use the net-income version whenever interest is material.
Levered Free Cash Flow Calculation in Practice: A Brewery Tests a Partner Distribution
It is the second week of January, and the managing partner of a three-partner craft brewery is closing the books on the year. The other two partners want a $250,000 year-end distribution. Before agreeing, she opens the term loan agreement and rereads one clause: only 50% of each year's excess cash flow may leave the business as distributions; the other half must go toward prepaying the loan. The agreement's excess cash flow is the cash left for owners after scheduled principal, the same figure this calculator produces, so its result is the number the 50% cap applies to.
From the year-end accounts she pulls four numbers and enters them exactly as they appear:
- EBITDA: $1,186,430, from the income statement with $204,110 of depreciation added back
- Net change in working capital: $97,815, mostly extra grain and aluminium cans bought ahead of a supplier price rise
- Capital expenditures: $412,260, of which $138,540 is a deposit on a second canning line due for delivery in March
- Mandatory debt repayments: $268,900, the twelve scheduled principal instalments on the term loan
The calculator returns $407,455. Half of that, $203,727.50, is the most the loan agreement allows the partners to take out. The requested $250,000 is $46,272.50 over the limit, which would put the brewery in breach of its covenant.
She changes one input. The canning-line deposit is not due until the line arrives, so she reruns the numbers with capital expenditures of $273,720 instead. The result rises to $545,995, and half of it, $272,997.50, now clears $250,000 with $22,997.50 to spare.
That gives the partners a concrete choice to vote on: pay $200,000 now and keep the March deposit on schedule, or pay the full $250,000 and move the deposit into the new fiscal year. She sends both figures, with the loan clause attached, before the partners' meeting on Friday.
Finding Levered FCF Inputs in the Financial Statements
Every input the tool needs is already published in a company's annual report; you only need to know which line to read.
- Operating earnings and revenue: the income statement gives revenue, cost of goods sold, gross profit, SG&A and operating income; add D&A back to operating income.
- Working capital: the cash flow from operating activities section of the cash flow statement lists changes in accounts receivable, inventory and accounts payable.
- Capital expenditures: look under investing activities for "purchases of property and equipment".
- Debt repayments: the cash from financing section shows principal repaid and new debt issuances, sometimes labelled financing activities.
Companies rarely label which repayments were mandatory, so you may need the debt footnote in the notes to the accounts or the balance sheet's current portion of long-term debt. When in doubt, the scheduled repayments disclosed in the notes are the cleanest proxy.
Levered FCF vs. Unlevered Free Cash Flow
Unlevered free cash flow (UFCF), also called free cash flow to the firm, measures cash available to every capital provider, creditors and owners alike. It starts from NOPAT (operating profit after tax, calculated as if the company had no debt), adds back D&A and subtracts working capital changes and capital expenditures. It ignores debt obligations entirely, so it does not depend on the capital structure.
Using the distributor again: NOPAT is $2,402,000 × 75% = $1,801,500, so unlevered free cash flow is $1,801,500 + $438,000 − $315,000 − $690,000 = $1,234,500. Subtract after-tax interest of $234,000 and the $520,000 principal payment and you are back at the $480,500 of cash available to owners. The two metrics are linked by the cost of servicing debt.

| Feature | Levered free cash flow | Unlevered free cash flow |
|---|---|---|
| Belongs to | Shareholders only | Debtholders and shareholders |
| Interest and principal | Deducted | Ignored |
| Starting point | Net income or EBITDA | Operating profit after tax |
| Matching discount rate | Cost of equity | WACC |
| Value produced in a DCF | Equity value | Enterprise value |
Choosing the Discount Rate for Each Free Cash Flow Measure
The discount rate must match whoever the cash flow belongs to. Levered cash flow belongs only to owners, so it is discounted at the cost of equity. Unlevered cash flow belongs to everyone, so it is discounted at the WACC, the weighted average cost of capital. Mixing them up (for example discounting levered numbers at the blended rate) inflates the result and is one of the most common modelling errors.
Which Free Cash Flow Metric Tells You More
Neither is better in general. Unlevered free cash flow makes it easier to compare two businesses with very different amounts of borrowed capital, while levered numbers tell you what an owner of this particular company, with this particular loan book, can actually take out. A large gap between the two is itself useful: it tells you how heavily debt service is weighing on the business and whether the leverage is manageable.
Reading Levered Free Cash Flow Across Several Years
One year of data can mislead you, because capital expenditures and stock levels move in lumps. Here is the same distributor over four years, which includes the year it built its second warehouse:
| Year | EBITDA | Increase in NWC | Capex | Debt payments | LFCF |
|---|---|---|---|---|---|
| Year 1 | 2,105 | 190 | 610 | 520 | 785 |
| Year 2 | 2,380 | 245 | 575 | 520 | 1,040 |
| Year 3 | 2,515 | 160 | 1,960 | 520 | −125 |
| Year 4 | 2,840 | 315 | 690 | 520 | 1,315 |
Negative Levered Free Cash Flow and What It Signals
Year 3 shows a negative levered free cash flow of −$125,000, but the business did not get weaker; operating earnings grew every year. The dip came entirely from a one-off $1,960,000 warehouse build. A negative result caused by expansion that later lifts earnings is healthy. A negative result caused by shrinking or negative operating earnings is a genuine problem, because it means the core business cannot cover its own costs, never mind its creditors. Always ask why the number is negative before you judge it.

Levered Free Cash Flow Growth Over Time
From $785,000 in Year 1 to $1,315,000 in Year 4, the distributor's levered free cash flow growth works out to a compound annual growth rate of about 18.8% over three years:
$$\text{CAGR} = \left(\frac{1{,}315}{785}\right)^{\frac{1}{3}} - 1 \approx 18.8\%$$Measuring CAGR from end point to end point smooths over the Year 3 dip, which is exactly what you want when judging the long-run trend. Companies that compound owner cash at double-digit rates for years tend to be strong cash generators, though you still need to check the price you pay against valuation multiples before treating them as a bargain.
Free Cash Flow to Equity in a Levered DCF
A levered DCF projects owner cash flow for each forecast year, discounts it at the owners' required return to its present value, adds a terminal value based on an earnings multiple such as P/E, and arrives at equity value directly. Dividing by the share count gives an implied share price, with no bridge from enterprise value needed. The time value of money works the same way as in any discounted cash flow model: a dollar of owner cash five years out is worth less than a dollar today.
The catch is that every item normally handled in the equity bridge now has to live inside the cash flow forecast:
- A full debt schedule, including new debt issuances and principal repayments each year
- Interest income on cash balances and interest expense that moves with interest rates
- Preferred stock dividends, deducted before common owners see any cash
- Tax savings from net operating losses
- The full lease expense, including operating leases under IFRS
Why Most Analysts Default to the Unlevered DCF
Because principal payments can be zero one year and enormous the next, a levered DCF swings far more than unlevered free cash flow forecasts, and the resulting value depends heavily on the financing assumptions. That is why the unlevered DCF remains the standard for most companies. The levered approach earns its place mainly for banks and other lenders, REITs and pipeline operators, businesses that borrow and repay on a predictable, level schedule.
Levered Cash Flow in Financial Modeling Practice
In financial modeling, it is still worth building a levered line even if you never present a levered DCF. Running both side by side is a cheap sanity check for investors: if the unlevered DCF says the shares are worth far more than the owners could ever receive in cash, the financing mix deserves a closer look. It is also a standard interview question, because it tests whether you understand which cash belongs to whom.
Common Mistakes When You Calculate Levered Free Cash Flow
Most errors come from mixing up signs and definitions rather than from arithmetic. Check these before trusting any result: See also our Dividend Payout Ratio Calculator.
- Entering a working capital increase with the wrong sign, which turns a cash outflow into a cash inflow
- Deducting interest twice, once inside profit after tax and again as part of debt payments
- Counting optional prepayments as mandatory, which understates the result for a company that is choosing to deleverage
- Using the shortcut formula for a heavily indebted company and ignoring interest and taxes
- Comparing a quarterly figure with an annual one without annualising
- Treating a single negative year as proof of weak financial health without looking at what drove it
- Comparing levered figures for one company with unlevered free cash flow for another
There is also no single agreed definition. Some analysts deduct every repayment and add every new loan, some deduct only mandatory amounts, and some ignore new borrowing altogether. Pick one convention, state it and apply it consistently across every period and company you compare.
Using Levered Free Cash Flow for Deals, Budgets and Debt Capacity
Beyond valuation, the metric earns its keep in everyday financial analysis wherever the question is "how much cash can we actually use?"
Private Equity and Leveraged Buyout Screening
In a leveraged buyout, a private equity sponsor cares about the cash left to pay down acquisition debt and eventually return to the fund. Ranking LBO candidates this way gives a quick view of that, though because an LBO replaces the existing capital structure, many sponsors screen on unlevered free cash flow first and model the new debt separately. Project finance banks use a related measure, CFADS (cash available to cover loan payments), which is calculated before interest and principal rather than after them.
Budgeting for Small Business Owners
For a small business, the same calculation works as a budgeting tool. If you financed your start-up with a bank loan, enter the year's scheduled loan principal as the debt input, and the result is the cash left for you as the owner after the debt obligations are met: the amount you can safely commit to a new hire or a second location. Tracking it year-over-year also shows your bank that profitability is turning into real cash, which helps when you ask for a larger credit line.
Related Metrics Worth Tracking Alongside It
- Operating cash flow: cash from operations before capex, a wider but less precise measure
- Free cash flow yield: free cash flow divided by market value, useful for comparing stocks
- Debt service coverage: operating cash compared with interest and principal due, which banks watch closely
Used together, these numbers show whether cash is being produced, where it goes and how much of it the owners can realistically count on, which is the whole point of measuring cash after creditors are paid.
FAQs around Levered Free Cash Flow Calculator
1. How do I calculate levered free cash flow?
Start with EBITDA, add the net change in working capital (negative when working capital grew and absorbed cash), then subtract capital expenditures and mandatory debt repayments: LFCF = EBITDA + change in NWC - CapEx - mandatory debt repayments.
2. What is the difference between levered and unlevered free cash flow?
Unlevered free cash flow is the cash available to all capital providers, lenders and shareholders alike, before any interest or principal is paid. Levered free cash flow deducts those debt payments, so it shows only what is left for shareholders.
3. Is a negative levered free cash flow bad?
Not necessarily. A negative result caused by a large one-off investment in equipment or facilities can be healthy if it lifts future earnings. It is a warning sign when it comes from weak or negative EBITDA, because the core business is not covering its own costs and debt payments.
4. What is a good levered free cash flow growth rate?
There is no single benchmark, but steady annual growth is the signal to look for. A company growing LFCF at around 20% a year doubles it in roughly four years, which usually supports higher dividends, buybacks and share prices over time.
5. Where do I find mandatory debt repayments?
Look in the cash from financing section of the cash flow statement for repayments of loans or notes, and check the debt footnote for the scheduled principal due each year. Companies rarely label which repayments are mandatory, so scheduled amounts are the best proxy.
6. Is too much free cash flow a bad thing?
Generally no. High free cash flow means a company can meet its obligations easily and fund dividends, debt reduction or growth. It only becomes a concern if the cash sits idle for years instead of being reinvested or returned to shareholders.
7. Which is better, levered or unlevered free cash flow?
Neither is better in every case. Unlevered free cash flow compares businesses with different amounts of debt more fairly, while levered free cash flow tells shareholders what they can realistically receive from a specific company with its current loans.
Report an issue with this page
Spotted a wrong result or unclear explanation? Report an issue or read our editorial policy.