

Expected Utility Calculator: Utility Function Examples
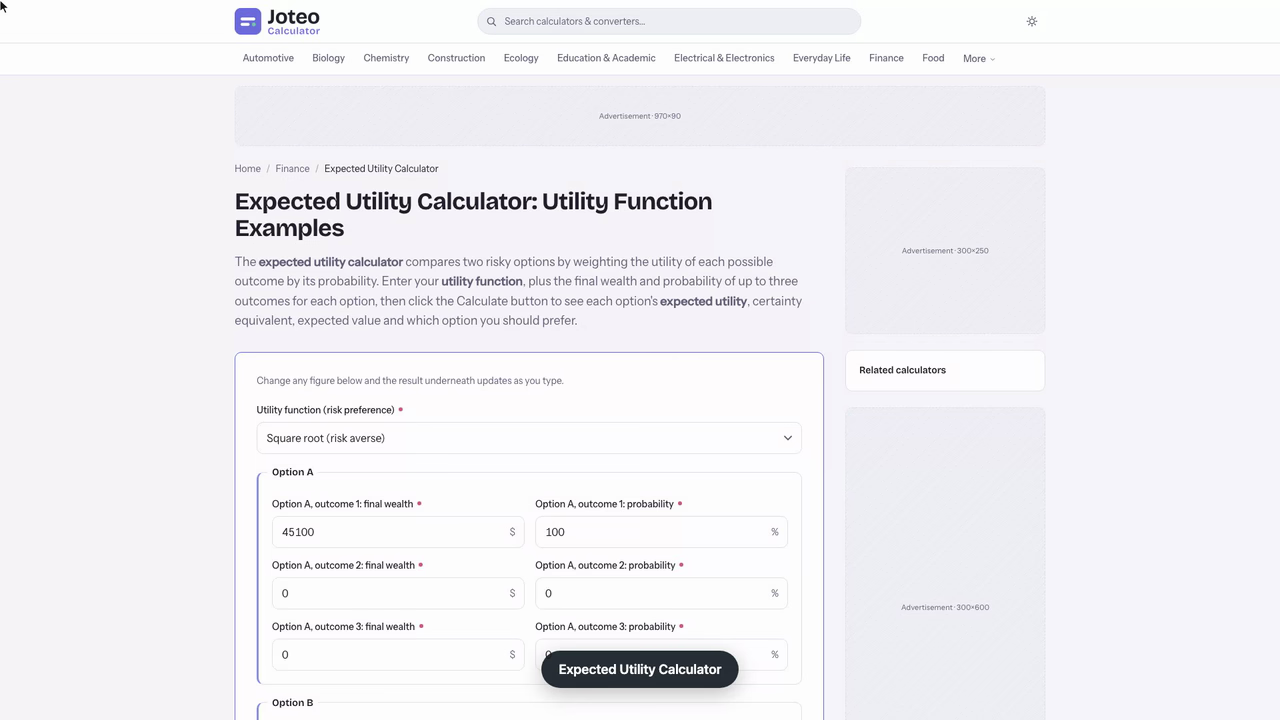
The expected utility calculator compares two risky options by weighting the utility of each possible outcome by its probability. Enter your utility function, plus the final wealth and probability of up to three outcomes for each option, then click the Calculate button to see each option's expected utility, certainty equivalent, expected value and which option you should prefer. Also try the Nav Calculator.
Expected Utility Calculator inputs and result
Preferred option
—
- Expected utility, Option A
- —
- Expected utility, Option B
- —
- Certainty equivalent, Option A
- —
- Certainty equivalent, Option B
- —
- Certainty equivalent gap
- —
- Expected value, Option A
- —
- Expected value, Option B
- —
Table of contents
Who wrote and checked this page


An expected utility calculator turns a risky bet into one comparable number: you list what could happen, say how likely each case is, and see which option leaves you better off once your own attitude toward loss is built in. The arithmetic is short, yet it explains why two sensible people can face the same odds in economics or everyday money matters and pick opposite answers.
Expected Utility Theory and How It Works
The expected utility theory says you judge a gamble by the satisfaction its results bring, not by their dollar size. The framework is mathematical: score every result, weight each score, add them up, and pick the option with the higher total. A calculator only automates that rule, and the theory still depends on the inputs you supply.
Weighted Sum of Possible Outcomes
The core step is a weighted sum: multiply the utility of each of the possible outcomes by its likelihood and add the products. When a probability distribution covers every case, the weights total 100%. An expected value weights raw dollars instead, so the utility version differs only because gains and losses pass through a curve first. Uncertainty enters through the weights, nowhere else.
Bernoulli's Original Idea
In 1738 Daniel Bernoulli noticed that a ducat means more to a poor merchant than to a rich one, so value should rise more slowly than wealth. John von Neumann and Kenneth Arrow later turned that observation into axioms. The result explains a familiar behavior: most people prefer a sure sum to a gamble with the same average, because certainty has its own worth.
Utility Function Formula
The formula adds one weighted score per case:
$$EU = p_1\,u(x_1) + p_2\,u(x_2) + \dots + p_n\,u(x_n)$$Each \(u(x)\) comes from a utility function, a rule that maps a result to a score reflecting your tastes. The square root is a popular pick because it flattens as wealth grows. Economists use the same idea for consumer preferences, where an indifference curve joins bundles that feel equally good. If one option beats another in every case, dominance settles the matter, and when the chances are only guesses, subjective probabilities carry the same weight. Under expected utility theory the recipe never changes.
Probability Inputs
Gather these before you start:
- The chance of each case, in percent, summing to 100%.
- Your final wealth in each case, in dollars.
- A utility rule, such as the square root, applied to every wealth figure.
- A total of expected utility for each option, so you can compare them.
Expected Utility Calculator Example: Buying Insurance
Dev keeps $48,000 in savings and faces an 8% yearly chance of a $30,000 repair bill. A policy costs $2,900. Scoring wealth with \(u(w) = \sqrt{w}\), does coverage beat going without? This kind of decision making is where the calculator earns its keep.
Payoff Table for Each Decision Alternative
Each decision alternative ends in one state of nature, either no repair or a repair. The payoff table below lists final wealth, and you can read it as a decision tree with one branch per option and one per state.
| Option | No repair (92%) | Repair (8%) |
|---|---|---|
| Buy the policy | $45,100 | $45,100 |
| Go without | $48,000 | $18,000 |
Expected Utility Analysis of Each Option
Apply the square root: \(\sqrt{48{,}000} = 219.09\) and \(\sqrt{18{,}000} = 134.16\). Going without scores 0.92 × 219.09 + 0.08 × 134.16 = 212.30, while the policy scores a certain \(\sqrt{45{,}100} = \) 212.37. Expected utility maximization picks the policy, the optimal choice by a hair. Comparing average dollars alone would decline it: $45,600 against $45,100.
Indifferent Premium and Break-Even Point
You are indifferent when the two scores match. A score of 212.30 equals certain wealth of about $45,069, so the most you would pay is roughly $2,931. A quick risk analysis of the chance gives the same story: at $2,900, coverage stops paying off once the repair chance falls below about 7.9%. Its expected return in dollars is $500 lower than going without, yet higher in utility.
A Freelancer Applies Expected Utility Analysis to Two Contract Offers
Mara Okonkwo-Reyes, a freelance engraver with $61,300 in savings, has two offers on the table and a day to answer. A studio will pay a flat $14,200. A gallery will pay a revenue share that lands at $27,800 with a 55% chance and $1,900 otherwise. She opens an expected utility calculator and enters final wealth rather than fees, because the curve should score what she ends up holding: $75,500 for the flat fee, $89,100 or $63,200 for the gallery.
She picks a natural-log utility, a common stand-in for risk aversion, and the sums come out in order. The flat fee scores ln(75,500) = 11.2319. The gallery scores 0.55 × 11.3975 + 0.45 × 11.0541 = 11.2430, which converts back to certain wealth of $76,341, or a certainty equivalent of about $15,041 in fees. That clears the flat fee by roughly 5.9%, and my own rule of thumb is to want at least 5% before accepting extra uncertainty. A plain average would have said $16,145 against $14,200, a much bigger gap that overstates the case.
| Chance of the big payout | Certainty equivalent of the gallery deal |
|---|---|
| 50% | $13,741 (below the flat fee) |
| 55% | $15,041 |
| 65% | $17,708 |
The rerun matters most. Solving for the break-even gives 51.8%, so her 55% estimate sits only a few points above the line. The number to watch is that chance, not the payout, because a pessimistic read of the gallery's sales history flips the answer. She also notes the caveat: a log curve assumes she can absorb the bad case, and if $63,200 would force her to dip into her rent reserve, the flat fee wins regardless of the score. She takes the gallery deal and keeps the flat fee as a fallback.
Risk Aversion and the Von Neumann Utility Curve
Risk aversion shows up as curvature. Plot utility against wealth on a graph and a bending line means a sure sum beats a gamble with the same average. A flatter bend signals higher risk tolerance, and you can maximize the total with fewer sacrifices. Change the curve and the winning option can flip.
Risk Neutral and Risk Seeking Preferences
A risk neutral person has a straight-line utility, so the score tracks average dollars exactly; this is risk neutrality. A risk seeking person has a curve bending upward and will pay to gamble. Run your numbers under all three shapes to see how fragile the answer is.
Weighted Average Decisions: Uses, Criticisms and Alternatives
Because the method is a weighted average of utilities, it supports decision-making wherever results carry odds, from an investment committee to a household budget.
Insurance, Savings and Portfolio Management
A household weighs a policy against its savings buffer exactly as Dev did above. A fund doing portfolio management repeats the steps with chance-weighted returns, scoring each portfolio's possible results through a concave curve so a deep loss counts for more than an equal gain. Risk management desks use the same scores to set position limits, and behavioral finance studies where real investors depart from them.
Alternatives for Rational Choice
The usual criticisms of expected utility theory are that people are not always rational, that probabilities are hard to pin down, and that fear distorts judgment. Prospect theory and regret theory are other models that try to describe real behavior; use them as a cross-check, not a replacement.
FAQs around Expected Utility Calculator
1. What does an expected utility calculator do?
It scores the final wealth of every possible outcome with a utility function, weights each score by its probability and adds them up. The option with the higher total is the better choice for your risk preference.
2. How is expected utility different from expected value?
Expected value averages raw dollars. Expected utility first passes each dollar figure through a curve, so a loss can count for more than an equal gain. That is why a risk-averse person may pay for insurance even when the policy costs more than the average loss.
3. What is a certainty equivalent?
It is the guaranteed wealth that gives the same utility as the gamble. If it is below the gamble's expected value, the gap is the premium you would give up to avoid the risk.
4. Which utility function should I choose?
Square root and natural log both describe risk aversion, with log bending more sharply. Linear means risk neutral, so the result matches expected value. Squared describes a risk seeker. Run all of them to see how sensitive the answer is.
5. Should I enter the payoff or my final wealth?
Enter final wealth in each case, meaning your savings plus or minus the outcome, because the utility curve should score what you end up holding.
6. Why must the probabilities total 100%?
Each option must cover every possible state of nature. If the chances do not sum to 100%, the weighted sum is not a true expected utility, so the calculator asks you to fix them.
7. Can I use it for insurance decisions?
Yes. Enter the policy as one option with the same wealth in every outcome, and going without cover as a second option with the loss as a lower-wealth outcome.
Report an issue with this page
Spotted a wrong result or unclear explanation? Report an issue or read our editorial policy.