

NAV Calculator: Net Asset Value and NAV per Share
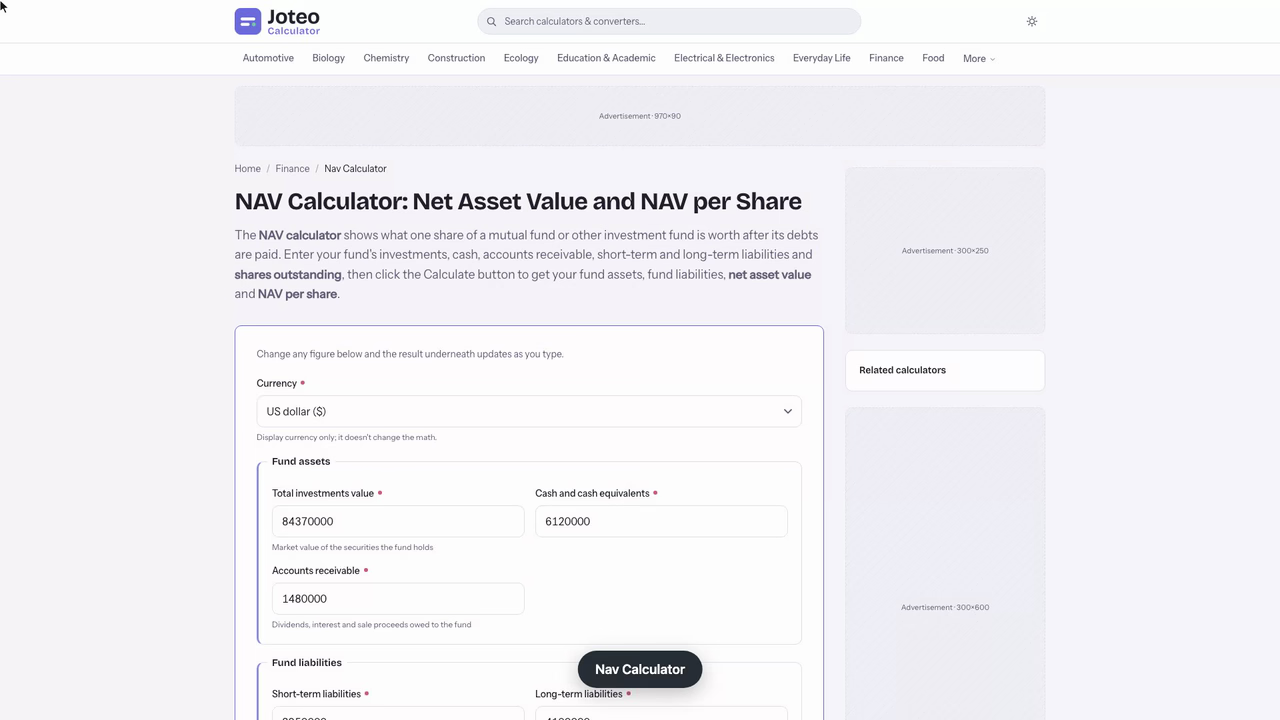
The NAV calculator shows what one share of a mutual fund or other investment fund is worth after its debts are paid. Enter your fund's investments, cash, accounts receivable, short-term and long-term liabilities and shares outstanding, then click the Calculate button to get your fund assets, fund liabilities, net asset value and NAV per share.
Nav Calculator inputs and result
Net asset value per share
—
- Net asset value (NAV)
- —
- Fund assets
- —
- Fund liabilities
- —
Who wrote and checked this page


Own a mutual fund and want to know what one share is really worth? This NAV calculator turns a fund's balance sheet into a single figure: its net asset value, in total and on a per-share basis. You enter the investment fund's total assets and total liabilities, and you get back what each share is worth after every debt is paid, the number investors buy and sell at.
What Net Asset Value Means for a Mutual Fund
Net asset value is the market value of the fund minus what it owes. All the securities, cash and receivables the fund holds go on one side; every bill, loan and accrued charge goes on the other. The difference is the fund's net assets, the fund value that belongs to shareholders. It plays the role market capitalization plays for a listed company, except it comes from the fund's own accounting rather than from demand and supply on an exchange.
Under the Investment Company Act of 1940, SEC regulations require every investment company running a mutual fund, as well as unit investment trusts, to calculate NAV at least once each business day, normally after the U.S. markets' closing. That daily disclosure is the transparency that lets investors check what a holding is worth.
Open-End Fund, Closed-End Fund and ETF Pricing
An open-end fund issues and redeems shares on demand, so its share price is set by the daily figure itself. A closed-end fund has a fixed number of shares that change hands on stock exchanges, where bid and ask quotes can push the market quote above its value (a premium) or below it (a discount). Exchange-traded funds sit in between: an ETF changes hands through the trading day on the secondary market, while large dealers keep its quote close to the published value. A REIT or a bond fund reports its value the same way.
The Net Asset Value Formula and NAV per Share
The net asset value formula subtracts what the fund owes from everything it owns. The NAV per share formula then spreads that result across the shares outstanding:
$$\text{NAV} = \text{Fund assets} - \text{Fund liabilities}$$
$$\text{NAVPS} = \frac{\text{Total assets} - \text{Total liabilities}}{\text{Outstanding shares}}$$
NAVPS, or net asset value per share, is the per share NAV a fund publishes each evening. Some funds call their shares units, but the NAV formula doesn't change: it measures value net of any liabilities, not what a buyer on the open market might pay.

Fund Assets and Fund Liabilities, Step by Step
To calculate NAV by hand, follow the same three-step sequence the tool runs:
- Add the fund assets: total investments at market value, plus cash and cash equivalents, plus accounts receivable such as dividends declared but not yet paid.
- Add the fund liabilities: short-term liabilities (payables, accrued management charges) plus long-term liabilities and any other debts.
- Subtract, then divide: assets minus liabilities gives the total; divide it by the share count for the per-share result.
Keep the units consistent through each NAV calculation. Mixing thousands and millions is the most common reason a hand result disagrees with a fund's published number.
NAV per Share Calculator Worked Example
Suppose you are checking an investment fund's latest quarterly report. Its portfolio of equities is valued at $84.37 million, it holds $6.12 million in cash and $1.48 million in receivables. Against that sit $2.95 million of short-term obligations and $4.10 million of long-term borrowing, with 5.26 million shares in issue. Entering those figures into the net asset value calculator gives:
- Everything owned: $84.37M + $6.12M + $1.48M = $91.97 million
- Everything owed: $2.95M + $4.10M = $7.05 million
- Net asset value: $91.97M − $7.05M = $84.92 million
- Value per share: $84.92M ÷ 5.26M = $16.14

Each share is backed by $16.14 of holdings once every obligation is settled. Because the valuation uses closing prices, the result is a snapshot: if the equities rose 1% tomorrow and nothing else changed, it would climb to about $16.30. Small items matter as well. An extra $0.5 million of accrued charges would trim it to $16.05.
Testing a Muni Fund's Market Discount Against a Fresh NAV Estimate
I hold a listed municipal bond fund whose quote has slipped to $11.87, and before I add 400 more shares I want to know whether that quote is cheap or whether the bonds underneath really lost ground. The answer: a NAV per share of $13.01, so the market is valuing the fund at an 8.75% discount.
The fund's semi-annual report has every figure the calculator asks for, and I enter its three inputs in balance-sheet order: what the fund owns, what it owes, and the share count.
- Bonds at value $318,642,900, cash $2,417,350, interest receivable $3,186,420: together $324,246,670
- Payable for bonds bought $1,904,600, accrued charges $612,780, bank borrowing $84,500,000: together $87,017,380
- Shares in issue: 18,236,500
Subtracting leaves $237,229,290, and dividing by the share count returns $13.0085. To cross-check, I redo it per share: $17.780 of holdings against $4.772 owed, which lands on the same $13.01. Notice that the $84.5 million bank loan is the largest item owed: it is subtracted in full, so borrowing directly lowers the net figure each share carries.
What stands out is how hard that borrowing amplifies moves, so I rerun the calculation with its holdings marked lower and everything else unchanged:
| Scenario | Bonds at value | NAV per share | Change |
|---|---|---|---|
| As reported | $318,642,900 | $13.01 | 0% |
| Bonds down 5% | $302,710,755 | $12.13 | −6.7% |
| Bonds down 10% | $286,778,610 | $11.26 | −13.4% |
A 5% slide in the bonds costs shareholders 6.7% of their per-share value, and a 10% slide costs 13.4%, because the loan stays the same size while the bonds shrink. At $11.26, today's $11.87 quote would no longer be a discount at all. The other trap is timing: this report is eleven weeks old, so an 8.75% gap measured against a stale figure could be pure noise.
So I pull the latest daily figures the fund posts on its own site and run the net asset value calculation again. If it still reads about $13.01, I place a limit order for 400 shares at $11.70, a 10.1% discount, instead of paying $11.87. My judgement: on a leveraged fund, a discount is only as good as the freshness of the per-share value behind it.
Using the NAV Calculator to Compare Funds Over Time
One reading on its own tells you little. Run the NAV calculator on two dates and the per-share change shows how the fund's holdings moved after costs, a quick NAV estimate of growth you can set against a benchmark for the same investment style. The figure reflects current market prices rather than a book value reduced by depreciation, so compare like dates, such as two quarter-ends.
Sales Loads and What You Actually Pay for a Share
The published value isn't always your cost. The pricing rule for a mutual fund is that you buy at the per-share value plus any purchase fees or front-end sales loads, and you receive that value minus any redemption fees when you sell. A 2% front-end load on the $16.14 share above means paying about $16.47. Check the prospectus's financial highlights for those charges before comparing a redemption amount with what you paid.

Fund Performance Beyond the Share Value
The figure drops when a fund pays out distributions, so a lower reading is not always a loss. Real fund performance adds those payouts back to give your investment's total return. Holdings also shape how far the figure moves between two calculator runs: a portfolio manager diversifying across many securities keeps the per-share value steadier, while a concentrated fund's swings sharply with a few positions.
FAQs around Nav Calculator
1. How do you calculate NAV per share?
Add the fund's investments, cash and receivables to get fund assets, subtract its short-term and long-term liabilities to get the net asset value, then divide that figure by the number of shares outstanding.
2. What is a good way to use NAV to judge fund performance?
Compare the NAV per share on two dates and add back any distributions paid in between. A single NAV only tells you the current value of a share, not how well the fund has done.
3. How often is a mutual fund's NAV calculated?
Mutual funds and unit investment trusts generally must calculate NAV at least once every business day, usually after the major U.S. exchanges close. Closed-end funds aren't bound by that daily rule, though many publish it often.
4. Is the price I pay for a fund share the same as its NAV?
For mutual funds you buy at roughly the per-share NAV plus any sales load or purchase fee, and you receive the NAV minus any redemption fee when you sell. ETFs and closed-end funds trade on exchanges, so their market price can sit above or below NAV.
5. What is the difference between an open-end and a closed-end fund?
An open-end fund issues and redeems shares at NAV whenever investors buy or sell, so its share count changes daily. A closed-end fund issues a fixed number of shares that trade on the market and can move to a premium or discount to NAV.
6. What is an ETF and does it have a NAV?
An exchange-traded fund is a pooled fund whose shares trade on an exchange throughout the day. It reports a NAV like a mutual fund, and its market price usually stays close to that value.
7. What counts as a fund liability?
Anything the fund owes: payables for securities bought, accrued management and operating charges, and any borrowing. Short-term items are due within a year; long-term liabilities are due later. All of them reduce the net asset value.
Report an issue with this page
Spotted a wrong result or unclear explanation? Report an issue or read our editorial policy.