

DART Rate Calculator: Free OSHA Formula and Benchmark
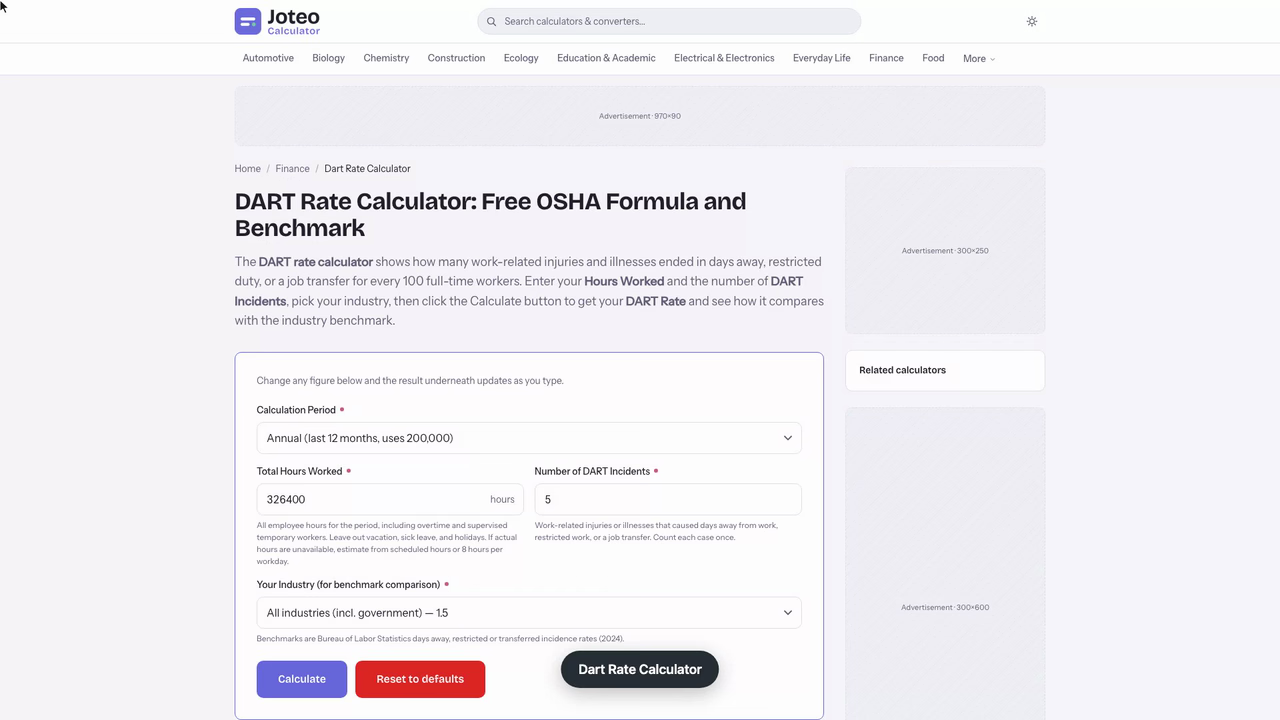
The DART rate calculator shows how many work-related injuries and illnesses ended in days away, restricted duty, or a job transfer for every 100 full-time workers. Enter your Hours Worked and the number of DART Incidents, pick your industry, then click the Calculate button to get your DART Rate and see how it compares with the industry benchmark. Also try the Emv Calculator.
Dart Rate Calculator inputs and result
Your DART Rate
—
- DART Incidents
- —
- Hours Worked
- —
- Multiplier
- —
- Industry Benchmark
- —
- Compared With Benchmark
- —
Table of contents
Who wrote and checked this page


Use this DART rate calculator to turn your injury log into one number: how often injuries ended in Days Away, Restricted, or Transferred status. Enter your case count and hours worked, and you see how your OSHA record stacks up against your sector. Below you get the calculation, a worked example, and advice on reading the result as a workplace safety signal.
OSHA Recordable Incidents and DART Cases Explained
Every DART case begins as an OSHA recordable event. Under OSHA recordkeeping rules, your employer must log work-related injuries and illnesses that affect employees and go beyond first aid, such as a case needing medical treatment, loss of consciousness, or a significant diagnosis. The DART cases are the severe subset of those recordable incidents, so every DART case is recordable while most recordable events are not.
Days Away From Work, Restricted Work, and Job Transfer
An injury counts toward the rate when a work-related injury leads to one of three outcomes. Days away from work start counting the day after the day of injury, and they apply whenever a physician or licensed healthcare professional says the employee must stay home. Restricted duty means the employee cannot perform one of the routine functions of the job (tasks done at least weekly) or cannot work a full shift. A job transfer moves the employee to other tasks so they can keep working. Restricted duties and transfers count even when nobody misses a shift.
DART Rate vs TRIR and Other Safety Metrics
The total case incident rate (TCIR), usually called TRIR, counts every recordable event, so it is never lower than your DART rate. Lost-time measures slice the same log differently, and the table shows the common ones with their hours basis.
| Metric | What it counts | Hours basis |
|---|---|---|
| TRIR | All OSHA recordable cases | 200,000 |
| DART | Days away, restriction, or transfer | 200,000 |
| Lost time case rate (LTIR) | Absences of a day or more | 200,000 |
| Lost workday rate (LWDR) | Total lost workdays | 200,000 |
| Lost time injury frequency rate (LTIFR) | Lost-time injuries | 1,000,000 |
| Total recordable injury frequency rate (TRIFR) | All recordable injuries | 1,000,000 |
A separate severity rate asks how long cases last rather than how many occur, so pair it with the DART rate when you report on both frequency and seriousness.
How the OSHA Formula Uses DART Incidents, Hours Worked, and 200,000
Count the DART incidents for the year, multiply by 200,000, and divide by the hours worked by all employees. This is the DART rate formula OSHA expects every employer to use:
$$\text{DART rate} = \frac{\text{DART cases} \times 200,000}{\text{hours worked}}$$
The constant equals 100 full-time workers putting in 40 hours a week for 50 weeks, so the result reads as cases per 100 full-time workers and lets a 30-person shop sit beside a 3,000-person plant. Knowing how to calculate DART rate by hand also lets you check any tool's output.
Worked Example With the OSHA 300 Log
Picture a plumbing-supply distributor whose payroll adds up to 326,400 hours across 157 full-time equivalent employees. Its OSHA 300 log lists nine recordable cases: two in the days-away column, three in the job transfer or restriction column, and four in the other-recordable column. OSHA Form 300 holds those entries, and the Form 300A summary totals them at year end. To calculate DART rate, add the first two columns, which gives five DART cases, counting any entry once even if it had both days away and restricted duty.
$$\frac{5 \times 200,000}{326,400} = 3.06 \approx 3.1$$
The result is 3.1 DART cases per 100 full-time workers. The same log gives a TRIR of 5.5, because all nine cases enter that incident count.
Using the Free DART Rate Calculator
Enter the hours worked over the past 12 months and the number of DART cases, then click the Calculate button. The DART rate calculator returns your rate beside the industry average for context. EHS managers treat the result as a KPI, so run it again whenever your incident reporting system logs another case. Switch on the monthly DART rate option to scale the base to 16,667 hours, and calculate your DART rate for each site before combining sites into the company-wide figure.
Entering Hours for Full-Time Employees
Add up the hours worked by your employees, including overtime and the time of temporary workers you supervise. Leave out paid leave such as holidays, vacation, and sick days. If payroll cannot supply an exact figure, estimate from scheduled hours, or from eight hours per workday, to get your manhours total. As a check, one of your full-time employees at 40 hours a week for 50 weeks adds 2,000 hours.
Calculating a Warehouse's DART Rate Before an Insurance Renewal
A safety coordinator at a regional distribution warehouse needs one figure for the insurer's renewal packet: how the site's DART rate sits against its peers. The OSHA Form 300A summary shows 14 qualifying entries, and payroll reports 612,480 hours worked, overtime included and paid leave stripped out.
Typing those two values into the tool returns 4.6. The coordinator checks it by hand, 14 × 200,000 ÷ 612,480 = 4.57, then sets it against the 1.4 to 1.5 all-industries figure from the BLS. That is roughly triple it, though warehousing is a high-rate trade, so the honest read is "high for us, not an outlier for our sector."
Two checks change the answer. The log lists one back injury twice, once for days away and again for light work, so the true count is 13. And 41,000 hours worked by agency temporary workers never reached payroll. Here is how each correction moves the result:
| Scenario | DART count | Total | Rate |
|---|---|---|---|
| As first entered | 14 | 612,480 | 4.6 |
| Duplicate removed | 13 | 612,480 | 4.2 |
| Temporary hours added | 14 | 653,480 | 4.3 |
| Both corrections | 13 | 653,480 | 4.0 |
The number to watch is the denominator, because an understated denominator inflates the rate silently. Both fixes together land at 4.0, and the next action is concrete: request the agency's hours, re-run the figure, and send the insurer a DART rate of 4.0 with a note on the duplicate. For perspective, reaching 3.0 would take cutting the count to 9 entries over the same year, a goal worth setting as a KPI. One caution: a rate built on few events swings hard, so this figure should never be the only evidence of how the site is doing.
How Days Away, Restricted, or Transferred Rates Compare With the Industry Average
Your number means little until you set it against peers. A good DART rate is one below the average for your own sector, and lower is better. Recent releases from the Bureau of Labor Statistics put private industry and all industries at roughly 1.4 to 1.5 cases per 100 workers. Transportation and warehousing run well above that, construction and manufacturing vary by trade, and office-based sectors sit far below. Some safety sheets call it the days away/restricted or job transfer rate, but it is the same measure. Treat the BLS figure for your sector as your industry benchmark and pick one benchmark to keep using year after year.
Bureau of Labor Statistics Data and Your NAICS Code
Find your six-digit NAICS code, then read the matching row of the BLS survey of occupational injuries and illnesses for that sector. Compare like with like: a roofing contractor measured against a broad construction average will look worse than it should, and the same trap works in reverse. Strong performance means your DART rate stays below your own sector's published figure.
Limits of the Rate for Workplace Safety Programs
The rate is a lagging indicator: it records harm after incidents happen, so it says little about hazard controls or injury prevention work. In small businesses a single case can swing the result sharply, so judge safety performance over several years. Never discourage reporting to keep the number low, because OSHA treats that as a compliance risk under 29 CFR 1904. COVID-19 cases enter the rate only when they meet the recording criteria.
FAQs around Dart Rate Calculator
1. What is a DART rate?
The DART rate (Days Away, Restricted, or Transferred rate) is an OSHA recordkeeping measure of how many work-related injuries and illnesses led to days away from work, restricted work, or a job transfer for every 100 full-time workers in a year.
2. How do I calculate my DART rate?
Multiply the number of DART incidents by 200,000, then divide by the total hours worked by all employees in the same period. The 200,000 equals 100 full-time workers at 40 hours a week for 50 weeks.
3. What is a good DART rate?
A good DART rate is one below the average for your own industry. The Bureau of Labor Statistics publishes average rates by NAICS sector each year, so find your sector's code and compare your result with the latest figure.
4. What is the difference between DART and TRIR?
TRIR counts every OSHA recordable case, while the DART rate counts only cases with days away, restricted work, or a job transfer. Both use the same 200,000-hour base, so DART is always equal to or lower than TRIR.
5. Which hours should I include?
Include every hour employees actually worked, with overtime and supervised temporary workers. Exclude vacation, sick leave, and holidays. If real hours are unavailable, estimate from scheduled hours or 8 hours per workday.
6. Does a day of injury count as a day away from work?
No. Days away start counting the day after the injury, and only when a physician or licensed healthcare professional says the employee must stay off work. An employee who is fully back on the next day is not a DART case.
7. How does the monthly option work?
The monthly option swaps the 200,000 multiplier for 16,667 (one twelfth), so a single month's hours and cases produce a rate that can be read on the same scale as the annual figure.
8. Do COVID-19 cases count toward the DART rate?
Only when the illness is confirmed, work-related, and meets the recording criteria, with days away, restricted work, or a job transfer. A case that does not meet those criteria is left out.
Report an issue with this page
Spotted a wrong result or unclear explanation? Report an issue or read our editorial policy.