

Price Per Share Calculator – Free Stock Average Calculator
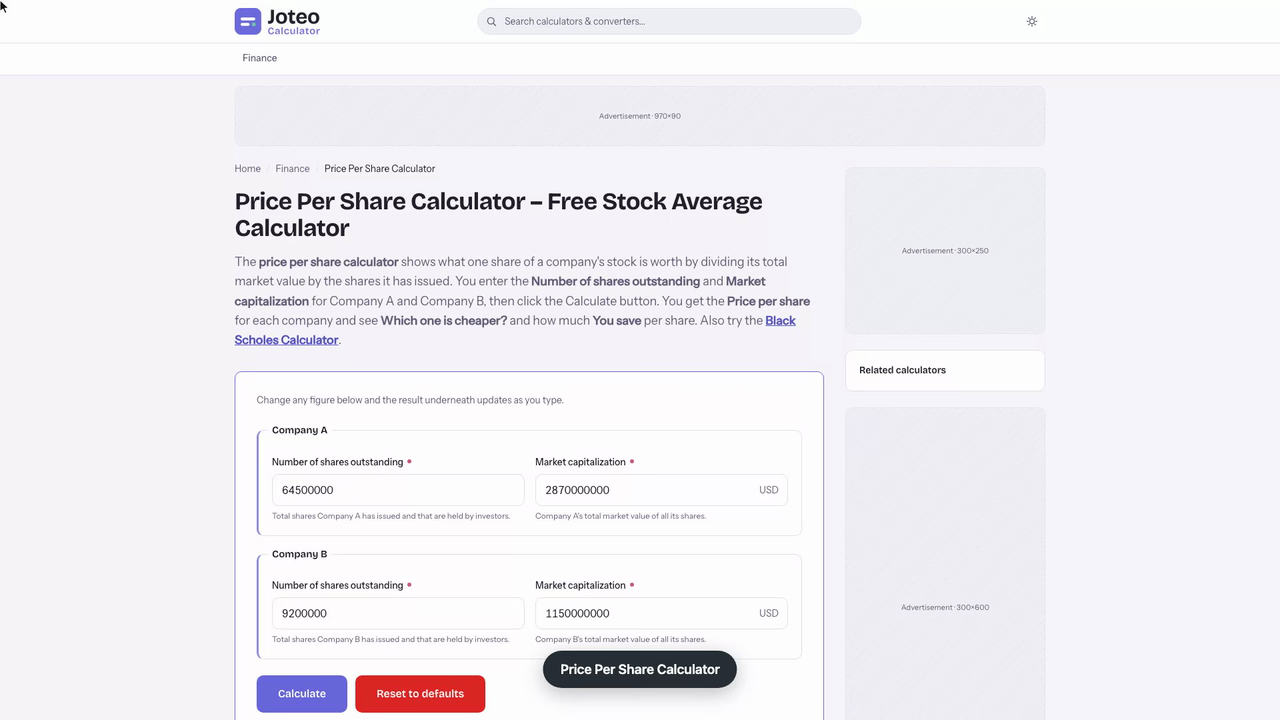
The price per share calculator shows what one share of a company's stock is worth by dividing its total market value by the shares it has issued. You enter the Number of shares outstanding and Market capitalization for Company A and Company B, then click the Calculate button. You get the Price per share for each company and see Which one is cheaper? and how much You save per share. Also try the Long Call Calculator.
Price Per Share Calculator inputs and result
Price per share (Company A)
—
- Price per share (Company B)
- Which one is cheaper?
- —
- You save (per share)
- —
Who wrote and checked this page


Bought the same stock three times at three different prices and lost track of what you really paid? The price per share calculator takes each purchase price and number of shares you enter and returns your average share price, the single number that tells you where your holding breaks even and how much of your portfolio is riding on it.
How the Price Per Share Calculator Works
Most people who buy stocks do it in stages. You might start with a small lot, add more after a pullback, and top up again months later. Each lot has its own cost, so no single confirmation slip tells you what your whole holding cost you per share. The tool fixes that by treating every lot as one line: you type in how many shares you bought and what you paid for each one, and it rolls every line into a single figure. See also our Bear Call Spread Calculator.
Many trading platforms show a running average once you already own the stock, but they can't show you what a purchase you haven't made yet would do to it. Because this share average calculator works on numbers you type in, you can test a buy before you place it, which is a useful piece of due diligence before you add to a holding or a name on your watch list.
Inputs: Share Price and Number of Shares
Every row asks for two things:
- Share price – what you paid per unit in that purchase, taken from your broker's contract note rather than today's stock market quote.
- Number of shares – how many shares of stock you bought in that purchase, including fractional shares if your broker sells them.
- Optional fees – if you want broker fees included, add them to the lot's cost before you divide (covered below).
Enter as many rows as you made buys. Keep the same number of decimal places for every price, since mixing $48.6 and $48.600 won't change the answer but mixing rounded and unrounded prices will.
What the Cost Basis Result Tells You
The tool returns three figures: the total cost of every lot combined, the total shares you hold, and the average you paid per unit. That last one is your cost basis per unit. When the market quote sits above it, your holding shows a profit; below it, a loss. It's the line an investor watches, not the price of any single lot.
Average Share Price Formula: How Stocks Are Averaged
The math behind a stock average is a weighted average, not a simple one. A lot of 40 shares should pull the answer harder than a lot of 5, so each price is multiplied by its own size before anything is divided: You might also find our Long Iron Butterfly Calculator useful.
$$\text{Average price} = \frac{(p_1 \times s_1) + (p_2 \times s_2) + \dots + (p_n \times s_n)}{s_1 + s_2 + \dots + s_n}$$
Here \(p\) is the price paid in each lot and \(s\) is the number of shares bought in that lot. Adding up every price and dividing by the count of lots would give a plain mean, which is wrong whenever the lots are different sizes. The same logic powers any weighted average calculator; this one is simply set up for stock purchases.
Numerator and Denominator Explained
The numerator is the total cost: every lot's price times its quantity, summed. The denominator is the total units held across every lot. Divide the first by the second and you have the average cost per share. If one side is wrong, say, you forgot a small lot bought through a dividend plan, the result drifts, so list every buy.
Adding Commissions to Your Cost Basis
Brokers that still charge commissions raise what you really paid. Add each fee to the lot's cost before dividing, so each row becomes \((p \times s) + \text{fee}\) per row. Tax rules in most countries let you include buying costs in your basis, which lowers the taxable gain later.
Stock Average Worked Example: Three Buys at Different Prices
Say you built a holding in a mid-cap retailer over one year with three separate purchases, as the price slid from the low $60s into the high $40s:
| Purchase | Number of shares | Price per share | Lot cost |
|---|---|---|---|
| March | 40 | $63.20 | $2,528.00 |
| July | 25 | $55.80 | $1,395.00 |
| November | 35 | $48.60 | $1,701.00 |
| Combined | 100 | — | $5,624.00 |
Plug those rows into the formula:
$$\frac{2{,}528 + 1{,}395 + 1{,}701}{40 + 25 + 35} = \frac{5{,}624}{100} = \$56.24$$
Your average price per share is $56.24. The $5,624.00 total is your cost basis for the whole holding, and $56.24 is that same figure spread across each share. Notice it sits closer to $55.80 than a simple mean of the three prices ($55.87) would suggest, because the heavy March lot drags it up while the November lot pulls it down.
If you paid a $4.95 commission on each trade, the top line grows by $14.85 to $5,638.85, and the basis per unit rises to $56.39. Run the same rows through any average share price calculator and you should land on that exact figure. Small, but it's the correct figure to report.
Now suppose the stock recovers and you sell all 100 shares at $61.75. The selling price minus the $56.24 average, times 100 units, gives a gain of $551.00 before fees, or $536.15 once the three buy fees are counted.
Average Down vs Average Up with a Stock Average Calculator
A stock average calculator earns its keep when you are deciding whether to add to a holding. Buying more at a lower price is called averaging down; buying more at a higher price is how you average up. Either way, the new lot changes the price you need to get back to, and the tool shows by how much before you commit cash.
When You Buy the Dip to Lower Your Break-Even Price
In the example above, had you stopped after March your break-even price would have been $63.20. The July and November lots cut it to $56.24, a drop of $6.96. That's the appeal of the strategy: if you buy the dip, the stock doesn't have to return to where it started for you to come out ahead.
You can also run it backwards. To bring the $56.24 average down to $54 by buying more at $48.60, you would need 42 more shares; the stock average calculator confirms the new figure at $53.98 across 142 shares. This habit of scaling into a position is common among buy-and-hold investors.
Avoiding a Falling Knife
Buying lower only works if the stock eventually recovers. If it keeps sliding, every new lot lowers your average but raises the amount of money at risk, and you end up catching a falling knife. Before each extra lot, ask whether the lower stock price means the business is genuinely undervalued or cheap for a reason, and check trading volume for signs of real selling pressure. An active trader will also weigh liquidity and the opportunity cost of tying up cash that could go elsewhere.
Adding at higher prices works the other way. Buying 30 shares at $67.40 to the 100 you hold lifts your average to $58.82. That's fine when you're confident in the trend, but it narrows the cushion between your basis and the current quote.
Checking a Year-End Tax Loss with the Average Share Price Calculator
It's the second week of December, and Dana is going through a taxable account before the year closes. One holding, a regional electric utility, has been drifting lower since spring, and she wants to know whether selling it now would lock in a loss she can use against a gain she took earlier in the year.
Her broker's app shows the current quote, $76.30, but not a clean basis, because part of the holding came from reinvested dividends. She pulls the four confirmations from her statements and enters one row each:
- 18 shares at $87.45, bought in April
- 12 shares at $79.10, bought in June
- 7.384 shares at $81.27, a September dividend reinvestment
- 22 shares at $72.65, bought in October after a sharp drop
She keeps the fractional 7.384 exactly as printed rather than rounding to 7, since that lot alone is worth about $600. The rows total $4,721.69 across 59.384 shares, and the tool returns an average price of $79.51 a share. That is the cost basis for the whole position.
At $76.30, the holding is worth $4,531.00, so selling everything today realises a loss of $190.69. The October lot on its own shows a gain, which is why she can't judge the position by the latest buy.
The number settles the decision. A $190.69 loss is enough to offset part of her earlier gain, so she sells all 59.384 shares on December 12. Because the US wash-sale rule disallows the loss if she buys the same security within 30 days, she sets a reminder for January 12, the 31st day, before she considers buying back in.
Cost Per Share Calculation from Market Capitalization
"Price per share" has a second meaning. Instead of what you paid, it can describe what the market says one unit of a business is worth. That version divides market capitalization by the number of outstanding shares:
$$\text{Share price} = \frac{\text{Total equity value}}{\text{Outstanding shares}}$$
A firm valued at $2.87 billion with 64.5 million units in issue trades at about $44.50. This is a quick sanity check on a quote, and it's how a unit price for any equity is backed out of the firm's total value.
Why a Higher Share Price Doesn't Mean a Bigger Company
A second firm worth only $1.15 billion but with 9.2 million units in issue trades at $125.00, almost three times the first firm's quote while being less than half its size. A single quote says nothing about total stock value on its own. Compare businesses using financial metrics such as earnings per share and the p/e ratio instead, which put all stocks on the same footing.
Using Your Average Cost Basis for Capital Gains and Taxes
Your average cost isn't just a trading number. When you sell, capital gains are measured as the sale proceeds minus your basis, so the figure the tool produces feeds straight into what you owe on the investment. In the worked example, the taxable gain is $536.15 once buying fees are included, not the full $6,175 you received.
Keep in mind that many revenue agencies don't use a pooled average for all your stocks. Some default to first-in, first-out lot matching, and some let you pick specific lots, so your broker's year-end statement may show a different gain than the average method. Check which rule applies where you file your taxes before you rely on it.
Stock Splits, Fractional Shares and Dividends
- Stock split: a 2-for-1 split turns 100 shares at $56.24 into 200 shares at $28.12. The total basis stays $5,624.
- Reinvested dividends: each reinvestment is a small purchase, so it gets its own row.
- Old holdings: if you've lost a contract note, your brokerage can usually supply it, or you can look up historical stock prices for the trade date.
Reading the Result: Average Stock Price Calculator Tips for Investors
Once you have your figure, use it to make informed decisions rather than emotional ones:
- Compare your average to the live, real-time quote to see whether the holding is up or down.
- Test any planned buy in the stock average calculator before you place the order, and look at how much it moves your average.
- Combine the result with a stock profit calculator when you want to model a sale at a target price.
- Track your rate of return against the basis, not against the price of your first lot.
Good investment strategies treat the average as a starting point for each holding in your portfolio, not a verdict. It won't tell you whether a stock will recover, only where you stand if it does. This page is an educational tool, not financial advice, so weigh your own situation before investing more in any of your stocks.
FAQs around Price Per Share Calculator
1. How do I calculate the price per share?
Find the company's total market capitalization and its number of outstanding shares, then divide the first by the second: price per share = market capitalization ÷ shares outstanding.
2. What is the price per share of a company worth $2.87 billion with 64.5 million shares?
Divide $2,870,000,000 by 64,500,000 shares. Each share is worth about $44.50.
3. Why does price per share matter to investors?
It tells you what the market charges for one unit of ownership, which is the number you pay when you buy and the starting point for ratios such as the P/E ratio.
4. Does a higher price per share mean a company is worth more?
No. A high share price can simply reflect fewer shares in issue. A company with fewer shares can trade at a higher price than a much larger company, so compare market capitalization or earnings-based metrics instead.
5. How do I find my average price per share after several purchases?
Multiply each purchase price by the number of shares bought, add those lot costs together, then divide by the total shares you hold. That weighted average is your cost basis per share.
6. Does a stock split change the price per share?
Yes. A 2-for-1 split doubles the shares outstanding and halves the price per share, but the company's market capitalization and your total cost basis stay the same.
Report an issue with this page
Spotted a wrong result or unclear explanation? Report an issue or read our editorial policy.