

Credit Spread Calculator: Max Profit, Max Loss & Breakeven
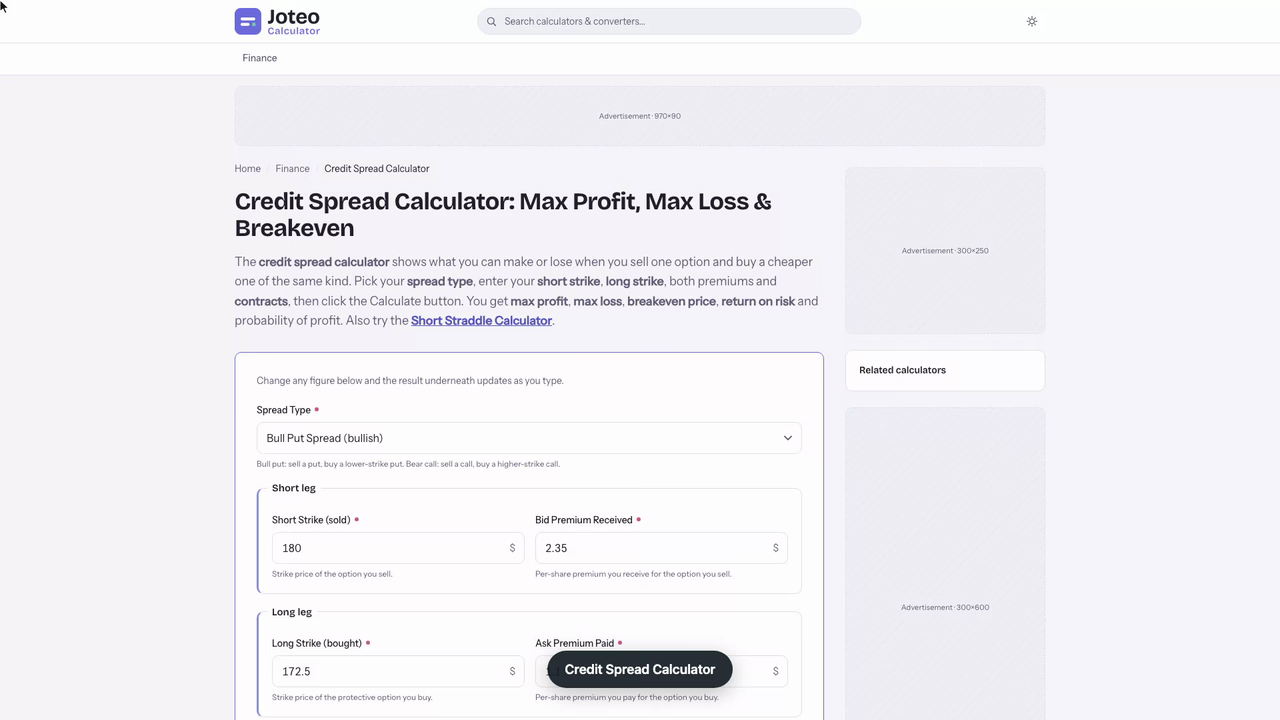
The credit spread calculator shows what you can make or lose when you sell one option and buy a cheaper one of the same kind. Pick your spread type, enter your short strike, long strike, both premiums and contracts, then click the Calculate button. You get max profit, max loss, breakeven price, return on risk and probability of profit. Also try the Long Put Calculator.
Credit Spread Calculator inputs and result
Max Profit
—
- Max Loss
- —
- Breakeven Price
- —
- Return on Risk
- —
- Estimated Probability of Profit
- —
Table of contents
Who wrote and checked this page


Before you sell a single option, the credit spread calculator shows you the worst case, the best case and the exact price where the trade flips from winner to loser. Enter your two strike prices, the net credit and your number of contracts, and you get back max profit, max loss, breakeven, return on risk and an estimated probability of profit in one pass, so you can size the position by what you could lose rather than by the premium you hope to keep.
What Is a Credit Spread?
A credit spread is a two-leg options strategy built from two options of the same type (two puts or two calls) with the same expiration but different strike prices. You sell the option closer to the current stock price, which is your short leg, and you buy a cheaper option further away, which is your long leg. Because the option you sell costs more than the one you buy, money lands in your account the moment the order fills. That cash is the net credit, and it is the most the trade can ever earn. See also our Protective Put Calculator.
Traders call it a vertical structure because the two strikes sit one above the other on the same expiration of an option chain. You will see the same trade described as a vertical spread, a vertical credit spread or simply an options spread. The names differ, but the math the calculator runs is identical, and it is one of the first structures most people meet in options trading because both the reward and the risk are fixed at entry. Any options chain quote screen gives you everything you need to price one: each option premium on the bid and ask side of the two strikes.
Put Credit Spread vs Call Credit Spread
Every credit strategy leans one way. A put credit spread, also called a bull put spread, is a bullish or mildly bullish trade: you sell a put at a higher strike and buy a put at a lower strike, and you keep the credit as long as the underlying finishes above the short strike price. A call credit spread, also called a bear call spread or short call spread, is a bearish trade: you sell a call at a lower strike and buy a call at a higher strike, and you keep the credit if the underlying finishes below the short strike price.
- Bull put spread: sell the higher-strike put, buy the lower-strike put, profit if the stock holds or rises.
- Bear call spread: sell the lower-strike call, buy the higher-strike call, profit if the stock stalls or falls.
- Both legs share the same expiration date, and both are either puts or calls, never one of each.
- The option you buy is your protection; it caps how far a bad move can hurt you.
Defined Risk Versus Naked Selling
Selling an option on its own, without a protective leg, is naked selling. A naked put can lose money all the way down to a stock price of zero, and a naked call has no theoretical ceiling on its loss because a stock can keep climbing. The long leg of a credit spread works like insurance: it sets a hard floor under your loss, which turns an open-ended short option into a defined risk trade. You give up part of the premiums you collect to pay for that insurance, and in return your worst case is known before you enter. That known worst case is also why most brokers set far lower margin requirements for a spread than for a naked short option.
How the Credit Spread Calculator Works
The calculator turns four or five numbers you can read straight off your broker's quote screen into the figures that decide whether a trade is worth placing. It never guesses at future prices; it applies fixed arithmetic to the strikes and prices you give it, so the same inputs always return the same outputs.
You may also see this tool labelled a put spread calculator or a call spread calculator depending on which side of the market it handles, or an options spread calculator when it also covers debit trades. A credit spread calculator excel workbook does the same math in spreadsheet cells, and the formulas below are exactly what you would type into one.
The Inputs You Enter
- Spread type: choose put credit (bullish) or call credit (bearish). This decides which way the breakeven moves from the short strike.
- Short strike: the strike price of the option you sell, the leg nearer the current price.
- Long strike: the strike price of the option you buy, further out of the money.
- Net credit: the bid premium you receive on the short leg minus the ask premium you pay on the long leg, quoted per share.
- Number of contracts: how many spreads you trade; each contract controls 100 shares, so every per-share figure gets multiplied by 100.
Max Profit, Max Loss and Breakeven Price
The first three outputs describe the shape of the trade at expiration. Max profit is the full credit you keep if both options expire worthless. Max loss is what you lose if the stock moves through both strikes: the distance between them minus the credit you already collected. The breakeven price is the stock price at expiration where the trade neither makes nor loses money.
Return on Risk and Estimated POP
The last two outputs help you judge quality rather than size. Return on risk divides max profit by max loss, so you can compare a narrow spread with a wide one on equal terms; it is simply the maximum profit expressed as a share of the maximum loss. The estimated POP is a rough probability of profit derived from how much of the spread width you were paid to accept. Some calculators show the same pair under different labels, such as cash needed for the capital at risk and rate of return for the percentage gain on that capital.
Vertical Spread Formulas Behind Each Result
Every output comes from a handful of short formulas. Using the symbols below keeps them readable: \(K_s\) is the short strike, \(K_l\) is the long strike, \(C\) is the credit per share, \(N\) is the number of contracts and \(S\) is the stock price at expiration.
Spread Width and the Credit You Keep
The spread width is the gap between the two strikes, in points:
$$W = |K_s - K_l|$$
The most you can earn is the credit itself, scaled up to dollars:
$$\text{Max Profit} = C \times 100 \times N$$
The most you can lose is the width you are exposed to, less the credit you already banked:
$$\text{Max Loss} = (W - C) \times 100 \times N$$
On most brokers this max loss figure is also the capital held aside for the trade, which is why a wider width ties up more of your account even when the credit looks attractive.
Break-Even Point for Each Direction
The break-even point moves away from the short strike price by exactly the credit, in whichever direction gives you room:
$$\text{Breakeven}_{\text{put}} = K_s - C \qquad \text{Breakeven}_{\text{call}} = K_s + C$$
A put-side trade loses money below its breakeven; a call-side trade loses money above it.
Return on Risk and the POP Approximation
$$\text{Return on Risk} = \frac{C}{W - C} \times 100\%$$
$$\text{POP} \approx 1 - \frac{C}{W}$$
The POP shortcut treats the market's pricing as fair: if you collect a third of the width, the market is implying roughly a one-in-three chance the spread ends at a full loss. It ignores volatility skew, dividends and the path the stock takes, so read it as a quick guide. Platforms that use Black-Scholes with a single implied volatility produce a more refined estimate, but the two rarely differ by more than a few points on a near-term spread. Those models also draw a curved T+0 line showing today's theoretical value, which sits inside the straight-edged expiration line until time runs out. The full payoff at expiration, for a put-side trade, combines both legs:
$$P/L = [\,C - \max(K_s - S,\,0) + \max(K_l - S,\,0)\,] \times 100 \times N$$
Bull Put Spread Example: Three Contracts on a $187 Stock
Here is a complete worked example with every number calculated from the formulas above.
The Trade Setup
You are mildly bullish on a stock trading at $187.40 and expect it to hold above $180 for the next month. On the option chain you sell the 180 put at its bid of $2.35 and buy the 172.50 put at its ask of $1.10, both in the same expiration, and you trade 3 contracts.
- Short strike: 180 put, sold for $2.35
- Long strike: 172.50 put, bought for $1.10
- Net credit: $2.35 − $1.10 = $1.25 per share
- Spread width: 180 − 172.50 = 7.50 points
- Contracts: 3
Reading the Results
| Output | Calculation | Result |
|---|---|---|
| Spread width | 180 − 172.50 | 7.50 points |
| Max profit | 1.25 × 100 × 3 | $375 |
| Max loss | (7.50 − 1.25) × 100 × 3 | $1,875 |
| Breakeven | 180 − 1.25 | $178.75 |
| Return on risk | 375 ÷ 1,875 | 20.0% |
| Estimated POP | 1 − (1.25 ÷ 7.50) | 83.3% |
The stock can fall from $187.40 to $178.75, a drop of about 4.6%, before this trade loses a dollar at expiration. That cushion is your margin of safety. The price of that cushion shows up in the ratio: you are risking $1,875 to make $375, so one full loss wipes out five full wins. An 83.3% POP only pays off if your actual win rate stays near that level over many trades.

Bear Call Spread Example: Four Contracts Below Resistance
Now take the mirror image. A stock trades at $64.20 and has failed twice near $67, so you are moderately bearish to neutral over the next few weeks. You sell the 68 call at $1.42, buy the 71 call at $0.57, and trade 4 contracts. You might also find our Diagonal Spread Calculator useful.
- Net credit: $1.42 − $0.57 = $0.85 per share; spread width: 3 points
- Max profit: 0.85 × 100 × 4 = $340
- Max loss: (3 − 0.85) × 100 × 4 = $860
- Breakeven: 68 + 0.85 = $68.85
- Return on risk: 340 ÷ 860 = 39.5%; estimated POP: 1 − (0.85 ÷ 3) = 71.7%
Compared with the bull put example, this call-side trade collects a larger share of its width, so its return on risk nearly doubles while its POP estimate drops by about 12 points. The narrower 3-point width also keeps the total max loss under $900 even with four contracts. If the stock closes at $70 at expiration, the short 68 call is worth $2.00, the long 71 call is worthless, and the result is a loss of $460: more than the credit, but well short of the capped maximum.
Checking a Call Credit Spread on a Utility Stock Before the Order Goes In
A part-time trader with a $61,380 account has watched a utility stock stall between $81 and $86 for seven weeks. It now sits at $83.17, and the October chain, 32 days out, shows the 87 call bid at $1.08 and the 90 call offered at $0.41. The plan is a bear call spread, but only if the numbers clear two personal rules: no more than 1.5% of the account at risk, and a breakeven at least 5% above the current price.
The trader types in 87 as the short strike, 90 as the long strike, and $0.67 as the credit ($1.08 minus $0.41), then starts with 3 contracts, because 1.5% of $61,380 is $920.70 and each contract risks $233.
| Result | Value |
|---|---|
| Max profit (3 contracts) | $201 |
| Max loss (3 contracts) | $699, or 1.14% of the account |
| Breakeven | $87.67, 5.41% above $83.17 |
| Return on risk | 28.8% |
| Estimated probability of profit | 77.7% |
Both rules pass. The $699 max loss is also the amount the broker will hold against the trade, since FINRA Rule 4210 margins a short vertical at the strike difference rather than as a naked call, so the trader checks that $699 of buying power is free.
One date on the calendar changes the plan. The stock goes ex-dividend nine days before expiration with a $0.74 quarterly dividend. If the 87 call is in the money that week and its remaining time value is below $0.74, early exercise becomes likely. So the exit rule is written down before entry: buy the spread back at the close before the ex-dividend date if the stock is above $87, or at $0.33, about half the credit, whichever comes first. With that rule in the journal, the order for three 87/90 call credit spreads goes in at $0.67.
Bull Put Spreads at Expiration: P/L Scenario Table
Max profit and max loss are only the two ends of the picture. A scenario analysis shows the profit/loss at every price in between, which is what a P/L diagram draws as a line. The table below applies the payoff formula to the three-contract bull put example at several stock prices at expiration.
| Stock price at expiration | Short 180 put value | Long 172.50 put value | Spread value | P/L (3 contracts) |
|---|---|---|---|---|
| $165.00 | $15.00 | $7.50 | $7.50 | −$1,875 (max loss) |
| $172.50 | $7.50 | $0.00 | $7.50 | −$1,875 (max loss) |
| $175.00 | $5.00 | $0.00 | $5.00 | −$1,125 |
| $177.00 | $3.00 | $0.00 | $3.00 | −$525 |
| $178.75 | $1.25 | $0.00 | $1.25 | $0 (breakeven) |
| $180.00 and above | $0.00 | $0.00 | $0.00 | +$375 (max profit) |
Where the Profit Zone Begins
Everything above $178.75 is your profit zone, and everything at or above $180 earns the full, capped $375. Between the two strikes, each $1 the stock falls costs you $300 across three contracts, because the short put gains intrinsic value while the long put is still worthless. Below $172.50 the long put starts gaining value dollar for dollar, which is why the loss line goes flat. That flat floor is what makes this a limited profit, limited loss risk profile.
- Above the short strike: both puts expire worthless and you keep the whole credit.
- Between the strikes: the spread value equals the short put's intrinsic value, and your result slides from profit to loss.
- Below the long strike: the spread is worth the full width and the max loss is locked in.

How the Net Credit Reshapes an Options Spread
For a fixed width, the only lever left is how much credit you accept, and that depends on how close to the money you sell. The table holds the 180/172.50 put structure constant at one contract and changes only the credit.
| Net credit | Max profit | Max loss | Breakeven | Return on risk | Estimated POP |
|---|---|---|---|---|---|
| $0.70 | $70 | $680 | $179.30 | 10.3% | 90.7% |
| $1.25 | $125 | $625 | $178.75 | 20.0% | 83.3% |
| $1.90 | $190 | $560 | $178.10 | 33.9% | 74.7% |
| $2.60 | $260 | $490 | $177.40 | 53.1% | 65.3% |
| $3.30 | $330 | $420 | $176.70 | 78.6% | 56.0% |
The Probability Versus Return Trade-Off
Read the table top to bottom and the pattern is plain. The row that looks safest, 90.7%, pays only 10.3% on the money at risk, so a single max loss of $680 erases nearly ten full wins. The bottom row earns 78.6% on risk but wins only a little more than half the time. Neither row is wrong. The point of running the numbers is to choose a strategy on that curve on purpose rather than by accident. Many traders settle near the 30-delta short strike, which often lands in the 65-75% POP range, and others place the short strike about one standard deviation away from the current price for a higher probability at a lower return.

Vertical Spreads, the Greeks and IV
At expiration only the strikes and the credit matter, but before expiration the value of credit spreads moves with the greeks. Understanding them explains why a trade can show a loss on day three even when the stock has not touched your short strike.
| Greek | Bull put spread | Bear call spread |
|---|---|---|
| Delta | Positive: gains as the stock rises | Negative: gains as the stock falls |
| Gamma | Negative: delta shifts faster near the short strike | Negative: delta shifts faster near the short strike |
| Theta | Positive: earns as time passes | Positive: earns as time passes |
| Vega | Negative: hurt when volatility rises | Negative: hurt when volatility rises |
Time Decay Works for the Seller
Time decay is the reason the credit strategy works at all. Each day an option loses part of its extrinsic value, and because the short leg is closer to the money, it usually loses more in dollars than the long leg. That net positive theta lets you collect premium steadily while the stock goes nowhere, which is why many traders treat a range-bound market as the ideal setting for premium income. It is also how the best-case figure the calculator reports actually gets earned: its results describe the last day, and decay is what carries the spread's value down toward zero, week by week, while the price stays out of reach.
How IV Changes the Credit You Collect
Higher IV lifts both premiums, but the short leg rises more, so the credit on offer grows when IV is elevated. Any trader watching a higher VIX reading will notice this: the credit on the same strikes tends to widen with it. The catch is that the same volatility that fattens the credit also means wider price swings, and a sudden IV spike after entry marks the spread against you even if the stock has not moved. Selling spreads just before earnings is a bet that IV will fall after the report, which is a separate risk from the direction bet.
Managing Bear Call Spreads and Bull Put Spreads Before Expiration
You do not have to hold every trade until the final bell. Most of the risk in credit spreads builds in the last week, when gamma is highest and small price moves swing the result from full profit to full loss.
Closing at 50 Percent of Max Profit
A common rule is to buy the spread back once it has captured about 50 percent of max profit. In the bull put example, that means closing when the spread can be bought back for about $0.62, which keeps $0.63 per share, or $189 across three contracts. You give up the last $186, but you free the capital, remove the tail risk of a late drop, and can redeploy into a fresh trade.
Assignment Risk, Pin Risk and Early Exercise
Defined risk is not the same as zero risk. If your short leg finishes in the money, expect assignment. If it finishes right at the money, you face pin risk: you may or may not be assigned, and you will not know until after the close. Both legs finishing out of the money lets them expire worthless, which is the outcome you want. American-style options can also be exercised before expiration. Early exercise is most likely on a short call just before an ex-dividend date when the remaining time value is smaller than the dividend, so check the calendar before holding a call-side trade through it. Early assignment on a short put is less common but happens when the put is deep in the money.
American-Style SPY Versus Cash-Settled Index Options
The settlement style of the underlying price you trade changes how assignment works:
| Product | Exercise style | Settlement | Assignment risk |
|---|---|---|---|
| SPY (S&P 500 ETF) | American | Shares | Yes, any day before expiration |
| QQQ (Nasdaq-100 ETF) | American | Shares | Yes, any day before expiration |
| S&P 500 index options | European | Cash | No early assignment |
Because SPY and QQQ options settle in shares, an assigned short put leaves you long 100 shares per contract until you act. European-style, cash-settledindex options avoid that problem entirely, which is why many spread sellers who trade SPY-sized notional amounts move to index products instead. The payoff math the calculator shows is the same for both.
Rolling a Tested Spread
Rolling means closing the current spread and opening a new one further out in time, often at strikes further from the price. It can buy the trade more time, but it is a new trade with a new max loss, so run the new strikes through the calculator before you commit rather than treating the roll as a repair.
Sizing Credit Spreads by Max Loss
The single most useful output for risk management is max loss, because position sizing should start there, not with the credit. Decide the max risk per trade you accept as a share of your account size, then divide that dollar figure by the max loss per contract.
Turning an Account Size Into a Contract Count
- Account size: $94,250
- Risk limit: 2% per trade, which is $1,885
- Max loss per contract on the 180/172.50 put trade: $625
- Contracts that fit: $1,885 ÷ $625 = 3.02, rounded down to 3
That is exactly the position size used in the bull put example. Had you sized off the $375 credit instead, the trade would have looked tiny and you might have doubled it, putting 4% of the account at risk on one idea. Remember too that commissions and exchange fees come out of every leg you open and close, so a four-leg round trip on three contracts can take a noticeable bite out of a $375 maximum.
When a Debit Spread Beats a Vertical Credit Spread
A debit spread reverses the structure: you buy the option nearer the money and sell the one further away, paying a net debit up front. Each strategy is defined-risk and built from the same two strikes, but they win in different conditions.
| Feature | Credit trade | Debit trade |
|---|---|---|
| Cash at entry | You receive the credit | You pay the debit |
| Max profit | The credit | Width minus the debit |
| Max loss | Width minus the credit | The debit |
| Time passing | Helps you | Hurts you |
| Needs the stock to move? | No, only to stay on the right side | Yes, past the breakeven |
| Best IV setting | Elevated volatility | Low volatility |
If you expect a large move, the debit version gives you a better risk/reward on the move itself. If you expect the stock to drift or stall, the credit version gets paid for that patience.
Common Mistakes When Reading a Vertical Spread Calculator
- Judging a trade by the net credit received alone. A large credit feels good until you see that max loss is several times larger.
- Chasing very high POP. A 90% trade that risks almost ten times its reward needs a near-perfect record to break even.
- Using mid-point premiums you cannot get. Wide bid-ask quotes and thin open interest mean slippage on both entry and exit. Check liquidity before you trust the credit the calculator shows.
- Ignoring the short leg's delta. Selling a strike price with a delta near 0.50 is close to a coin flip, whatever the ratio says.
- Treating the calculator as a forecast. It maps the premium received against the risk; it does not predict where the stock goes.
- Forgetting that an iron condor is two spreads. Iron condors combine a bull put and a bear call on the same underlying, and each side needs its own check.
The figures on this page are for educational purposes and are not financial advice. Every options strategy carries real risk, and investors should confirm prices, margin rules and assignment policies with their own broker before placing any trade.
FAQs around Credit Spread Calculator
1. What does a credit spread calculator work out?
It takes your two strike prices, the premium you receive and pay, and the number of contracts, and returns the max profit (the net credit), the max loss (spread width minus the credit), the breakeven price, the return on risk and a rough probability of profit, all measured at expiration.
2. Why is max loss equal to the spread width minus the credit?
If the stock moves through both strikes, the spread is worth its full width, so you owe that amount. You already collected the net credit when you opened the trade, so the net amount you lose is the width minus that credit, times 100 shares per contract.
3. Is a put credit spread bullish or bearish?
A put credit spread (bull put spread) is bullish: you want the stock to stay above the short put strike. A call credit spread (bear call spread) is bearish: you want the stock to stay below the short call strike.
4. How is the breakeven price calculated?
For a bull put spread, breakeven is the short strike minus the net credit per share. For a bear call spread, it is the short strike plus the net credit per share. At that price at expiration, the loss on the short option exactly cancels the credit.
5. Why do high probability of profit trades have a low return on risk?
A far out-of-the-money short strike wins more often but pays a small credit against a large max loss. One full loss can erase many small wins, so read the probability and the return on risk together.
6. Should I close a credit spread before expiration?
Many traders buy the spread back once it has captured about 50 percent of its max profit. This locks in part of the gain, frees capital and avoids the last-week swings when the short strike is near the stock price.
7. Can I still be assigned on a defined-risk spread?
Yes. American-style stock and ETF options can be exercised early, especially a short call just before an ex-dividend date. Your long option still caps the loss, but you may need to close or exercise it to finish the position.
8. How accurate is the estimated probability of profit?
It uses the shortcut 1 minus credit divided by width, which treats the market price as fair. It ignores volatility skew, dividends and the path the stock takes, so use it as a quick guide rather than a forecast.
Report an issue with this page
Spotted a wrong result or unclear explanation? Report an issue or read our editorial policy.